
Image
|
Figure Caption
Fig. 10
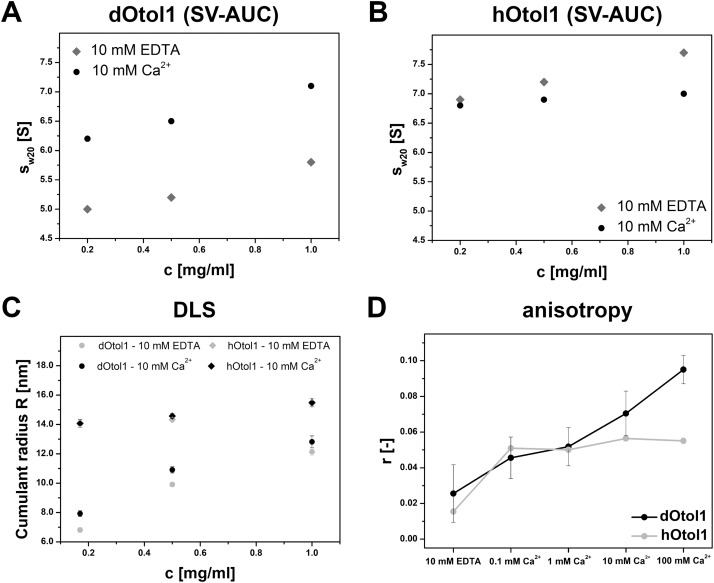
Fig. 10. The changes in derived from AUC of 0.2 mg/ml, 0.5 mg/ml and 1.0 mg/ml concentrations of dOtol1 (A) and hOtol1 (B) in the presence of 10 mM EDTA or 10 mM Ca2+. The sedimentation profile is shown in Fig. S4. Panel C represents the dependence of the cumulative radius of dOtol1 and hOtol1 on protein concentration and Ca2+ presence estimated with DLS. The fluorescence anisotropy values of ATTO-488-labelled dOtol1 and hOtol1 at increasing Ca2+ concentrations are shown in Panel D.
Acknowledgments
This image is the copyrighted work of the attributed author or publisher, and
ZFIN has permission only to display this image to its users.
Additional permissions should be obtained from the applicable author or publisher of the image.
Reprinted from International journal of biological macromolecules, 209(Pt A), Bielak, K., Hołubowicz, R., Zoglowek, A., Żak, A., Kędzierski, P., Ożyhar, A., Dobryszycki, P., N'-terminal- and Ca2+-induced stabilization of high-order oligomers of full-length Danio rerio and Homo sapiens otolin-1, 1032-1047, Copyright (2022) with permission from Elsevier. Full text @ Int. J. Biol. Macromol.