
Image
|
Figure Caption
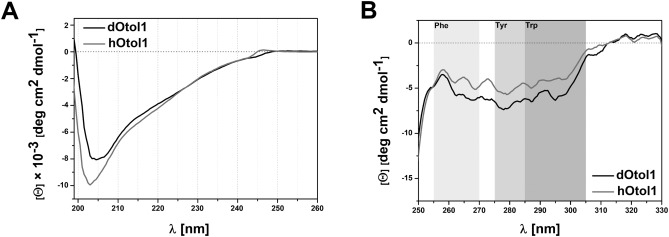
Fig. 2 Fig. 2. Circular dichroism spectra of dOtol1 and hOtol1 in far (A) and near (B) ultraviolet light in buffer F. For far-UV CD spectroscopy, a 10-μM protein concentration was used, while for near-UV CD, the protein concentration was 40 μM. The internal column graph in A shows the structure content after spectral deconvolution with CDNN 2.1. software. The near-UV CD spectra regions (B) are marked in grey corresponding to signals derived from Trp, Tyr and Phe residues in the range of 285–305 nm, 275–285 nm and 255–270 nm, respectively.
Acknowledgments
This image is the copyrighted work of the attributed author or publisher, and
ZFIN has permission only to display this image to its users.
Additional permissions should be obtained from the applicable author or publisher of the image.
Reprinted from International journal of biological macromolecules, 209(Pt A), Bielak, K., Hołubowicz, R., Zoglowek, A., Żak, A., Kędzierski, P., Ożyhar, A., Dobryszycki, P., N'-terminal- and Ca2+-induced stabilization of high-order oligomers of full-length Danio rerio and Homo sapiens otolin-1, 1032-1047, Copyright (2022) with permission from Elsevier. Full text @ Int. J. Biol. Macromol.