
- Title
-
Zebrafish obesogenic test identifies anti-adipogenic fraction in Moringa oreifera leaf extracts
- Authors
- Matsuoka, I., Hata, K., Katsuzaki, H., Nakayama, H., Zang, L., Ota, M., Kim, Y., Chu, D.C., Juneja, L.R., Nishimura, N., Shimada, Y.
- Source
- Full text @ Food Sci Nutr

CH2Cl2 extract reduces total visceral adipose tissue (VAT) in high‐fat diet‐fed zebrafish. (a) Experimental design of this study. (b) Preparation of MO extracts. Extracts were prepared using serial extraction with each solvent. (c) NR fluorescent intensities in the VAT were calculated. The Y‐axis indicates the ratio of NR staining before and after 48‐h treatment with each extract. Data are shown as the means ± standard deviation. |
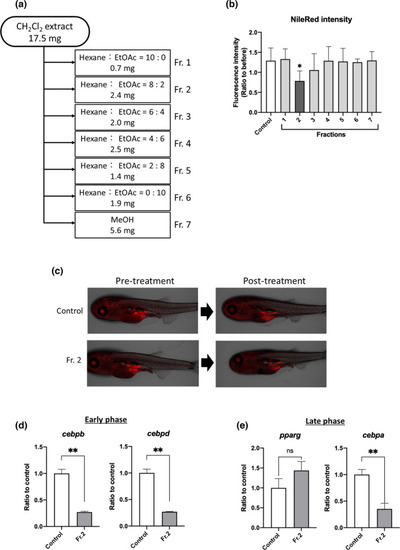
Fraction 2 of CH2Cl2 extract suppresses adipogenesis in zebrafish VAT. (a) Flow chart showing elution fractions obtained using silica gel chromatography. (b and c) Zebrafish obesogenic test. Fraction 2 (10 μg/ml) reduced the amount of VAT compared to control treatment (0.1% DMSO). Data are shown as the means ± standard deviation. PHENOTYPE:
|

Subfractions of Fr. 2 suppress adipogenesis. (a) Fr. 2 was subfractionated into seven pools including washout. (b) The yield of each step. (c) Zebrafish obesogenic test. the 4th, 5th, and 6th fractions (10 μg/ml) reduced the amount of VAT. *p < .05 versus control, n = 5, error bars indicate standard deviation (SD). (d) In vitro adipogenesis assays using mouse preadipocyte 3T3-L1 cells. Data are shown as the means ± SD. n = 8, *p < .05 versus control, as calculated by using one-way ANOVA. (e) Representative images of (d). Red indicates mature adipocytes
|