
Image
|
Figure Caption
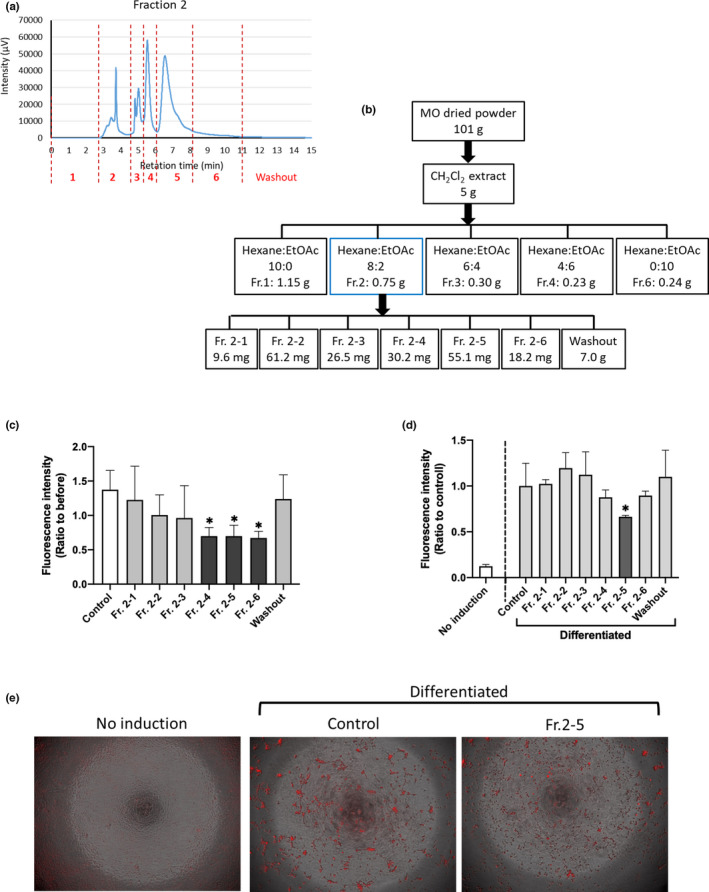
FIGURE 3
Subfractions of Fr. 2 suppress adipogenesis. (a) Fr. 2 was subfractionated into seven pools including washout. (b) The yield of each step. (c) Zebrafish obesogenic test. the 4th, 5th, and 6th fractions (10 μg/ml) reduced the amount of VAT. *p < .05 versus control, n = 5, error bars indicate standard deviation (SD). (d) In vitro adipogenesis assays using mouse preadipocyte 3T3-L1 cells. Data are shown as the means ± SD. n = 8, *p < .05 versus control, as calculated by using one-way ANOVA. (e) Representative images of (d). Red indicates mature adipocytes
Acknowledgments
This image is the copyrighted work of the attributed author or publisher, and
ZFIN has permission only to display this image to its users.
Additional permissions should be obtained from the applicable author or publisher of the image.
Full text @ Food Sci Nutr