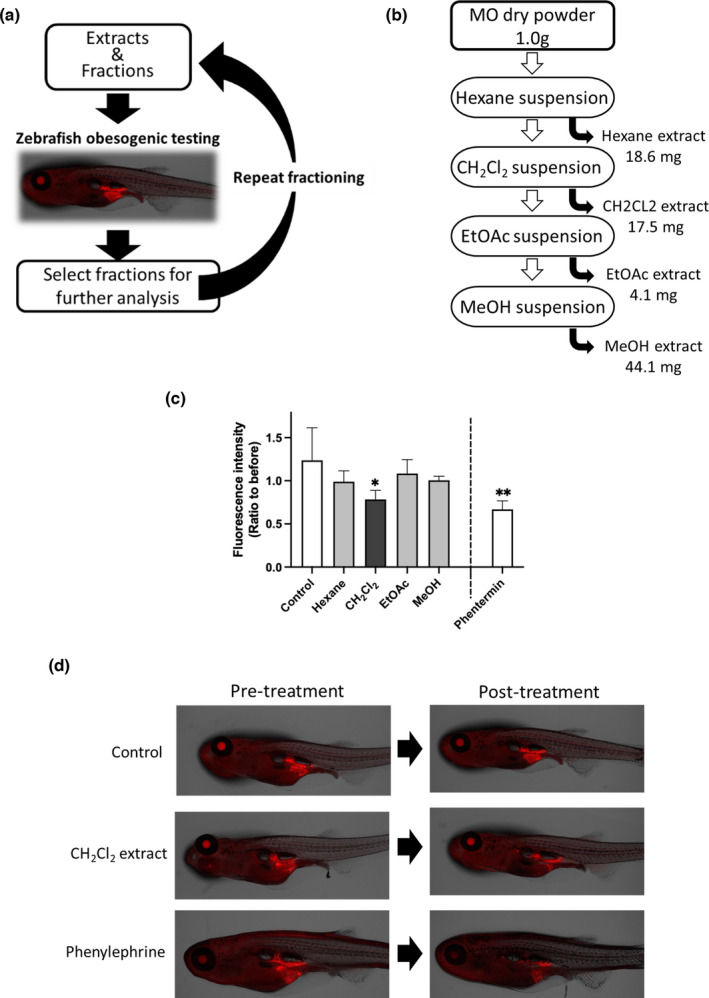
IMAGE

FIGURE 1

ID
ZDB-IMAGE-220420-27
Source
Figures for Matsuoka et al., 2022
Image
Figure Caption

FIGURE 1

CH2Cl2 extract reduces total visceral adipose tissue (VAT) in high‐fat diet‐fed zebrafish. (a) Experimental design of this study. (b) Preparation of MO extracts. Extracts were prepared using serial extraction with each solvent. (c) NR fluorescent intensities in the VAT were calculated. The Y‐axis indicates the ratio of NR staining before and after 48‐h treatment with each extract. Data are shown as the means ± standard deviation. n = 5, *p < .05 versus control, as calculated by using one‐way ANOVA. Reproducibility test results are displayed in Figure S2. Each extract was administered at 10 μg/ml. Phenylephrine (20 μM) was used as a positive control. (d) Representative images of control‐ and CH2Cl2 extract‐treated zebrafish

Acknowledgments
This image is the copyrighted work of the attributed author or publisher, and ZFIN has permission only to display this image to its users. Additional permissions should be obtained from the applicable author or publisher of the image. Full text @ Food Sci Nutr