Technical setup and drug pellet preparation. (A) Schematic overview of the drug-pellet formulation and manufacturing pipeline. (B) Dry fish food mix and the food–agar mixture resuspended in water. (C) The red-colour food–agar paste becomes pink once supplemented with vemurafenib dissolved in DMSO. (D) The tools used for pressing drug pellets in the mould. (E) Sequential series of photos (I-VI) showing the process of drug-pellet pressing. The parafilm sheet is peeled from the backing paper, and the mould is placed on the backing paper. The drug paste is applied on to the mould (I), and the parafilm sheet is gently lowered to cover the paste and mould (II). Next, using the roller, the drug paste is evenly applied into the holes of the mould (III-V). The parafilm sheet is lifted, followed by carefully removing the mould, and the drug pellets adhere to the backing paper (VI). (F) A freshly prepared batch of drug pellets. Surface tension retains the pellets on the parafilm backing paper. (G) A drug pellet recovered from −80°C storage, maintaining the flat-cylinder shape. The ruler shown in the picture is scaled in cm/mm. (H) Drug pellets aliquoted into daily doses per fish in PCR tubes, ready for −80°C storage, with arrows highlighting the drug pellets inside the tubes.

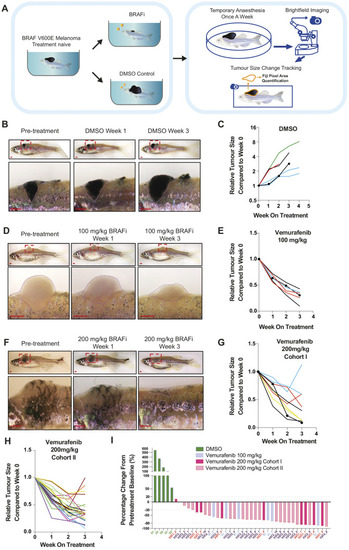
Short-term assessment of vemurafenib pellets on BRAFV600E zebrafish melanoma. (A) Schematic overview of drug-pellet free feeding administration, tumour response tracking and evaluation for each fish treated with vemurafenib or DMSO pellets. (B) Representative images of BRAFV600E zebrafish melanoma progression under treatment with DMSO pellets. Zoomed regions are indicated by red dashed line boxes. Dotted lines outline the melanoma. Scale bars: 1 mm. (C) Quantification of melanoma size change each week (by fold) under treatment with DMSO pellets, comparing to the lesion imaged on the day pre-treatment. Fish receiving DMSO pellets, N=4; lesion count, n=6. Lesions from the same fish are presented in the same colour. The large lesion presented in B is indicated by round dots. (D) Representative images of BRAFV600E zebrafish melanoma regressing under daily treatment with 100 mg/kg vemurafenib pellets. Dotted lines outline the melanoma. Scale bars: 1 mm. (E) Quantification of melanoma size change each week under daily treatment with 100 mg/kg vemurafenib pellets (by fold), compared to pre-treatment. Fish receiving 100 mg/kg vemurafenib pellets, N=3; lesion count, n=6. Lesions from the same fish are presented in the same colour. The lesion presented in D is indicated by round dots. (F) Representative images of BRAFV600E zebrafish melanoma regressing under treatment with 200 mg/kg vemurafenib pellets. Scale bars: 1 mm. (G) Quantification of melanoma size change each week under daily treatment with 200 mg/kg pellets (by fold) for Cohort I, comparing to the lesion imaged on the day pre-treatment. Fish receiving 200 mg/kg vemurafenib pellets, N=4; lesion count, n=9. Lesions from the same fish are presented in the same colour. The lesion presented in F is indicated by round dots. (H) Quantification of melanoma size change each week under daily treatment with 200 mg/kg vemurafenib pellets (by fold) for Cohort II, comparing to the lesion imaged on the day pre-treatment. Fish receiving 200 mg/kg vemurafenib pellets, N=10; lesion count, n=22. Lesions from the same fish are presented in the same colour. (I) Waterfall plot ranking melanoma size change after 3-week daily treatment with DMSO, 100 mg/kg vemurafenib or 200 mg/kg vemurafenib pellets (by percentage), compared to each lesion imaged on the day pre-treatment. Fish receiving DMSO pellets, N=3; lesion count, n=5. Fish receiving 100 mg/kg vemurafenib pellets, N=3; lesion count, n=6. Fish receiving 200 mg/kg vemurafenib pellets (Cohort I), N=4; lesion count, n=9. Fish receiving 200 mg/kg vemurafenib pellets (Cohort II), N=10; lesion count, n=22. Lesions from the same fish are indicated with the same x-axis label. D, DMSO; V1, vemurafenib 100 mg/kg; V2C1, vemurafenib 200 mg/kg Cohort I; V2C2, vemurafenib 200 mg/kg Cohort II.

Long-term vemurafenib drug-pellet treatment causes acquired drug resistance in zebrafish melanoma. (A) Representative images of BRAFV600E zebrafish melanoma before treatment, regressed melanoma and progressive disease for the animals shown in B. Scale bars: 1 mm. (B) Quantification of melanoma size change each week under treatment with 100 mg/kg or 200 mg/kg vemurafenib pellets after dose escalation. Fish receiving vemurafenib pellets, N=4; lesion count, n=6. Each coloured line represents one lesion, with the size change tracked over the entire treatment course. Lesions from the same fish share the same colour. The representative lesion shown in A is indicated by round dots. (C) Representative images of BRAFV600E zebrafish melanoma before treatment, during melanoma regression and evidence of recurrent disease while on consistent treatment of 200 mg/kg vemurafenib. Scale bars: 1 mm. (D) Quantification of melanoma size change each week under treatment with 200 mg/kg vemurafenib pellets. Fish receiving vemurafenib pellets, N=6; lesion count, n=14. Each coloured line represents one lesion, with the size change tracked over the entire treatment course. Lesions from the same fish share the same colour. The representative lesion shown in C is indicated by round dots.

On-target efficacy of vemurafenib drug-pellet treatment. (A) Representative images of Haematoxylin and Eosin (H&E) and immunofluorescence staining of BRAFV600E zebrafish melanoma samples treated with DMSO or vemurafenib drug pellets. Phospho-Erk1/2 staining in melanoma cells (M) is clearly visible in zoomed regions. Regressing melanomas have reduced phospho-Erk1/2 staining, and the response is varied in vemurafenib-resistant disease. Scale bars: 100 μm. DMSO-treated melanoma sample (week 3; DMSO treatment); melanoma regression sample (week 3; 200 mg/kg vemurafenib treatment); melanoma-resistant tumour A and B (week 10; 5-week 100 mg/kg vemurafenib treatment, followed by 5-week 200 mg/kg vemurafenib treatment). (B,C) Quantification of immunofluorescence staining intensity of phospho-Erk1/2 (B) and total Erk1/2 (C) from BRAFV600E zebrafish melanoma samples treated with DMSO, regressing on vemurafenib drug pellets and resistant to vemurafenib. The DMSO-treated samples were collected after 2 or 3 weeks of treatment (N=4 fish, n=5 lesions). The regressing samples were collected at week 3, 200 mg/kg vemurafenib treatment (N=4 fish, n=5 lesions). The resistant samples were collected at week 10, 5-week 200 mg/kg vemurafenib treatment escalation course following the initial 5-week 100 mg/kg vemurafenib treatment (N=3 fish, n=6 lesions). Data are mean±s.d.; multiple t-test with Sidak–Bonferroni correction. ns, not significant; **P<0.01; ****P<0.0001. Lesions from the same fish are indicated by the same colour.

Acknowledgments
This image is the copyrighted work of the attributed author or publisher, and ZFIN has permission only to display this image to its users. Additional permissions should be obtained from the applicable author or publisher of the image. Full text @ Dis. Model. Mech.