IMAGE

Fig. 2.

ID
ZDB-IMAGE-220521-19
Source
Figures for Lu et al., 2022
Image
Figure Caption

Fig. 2.

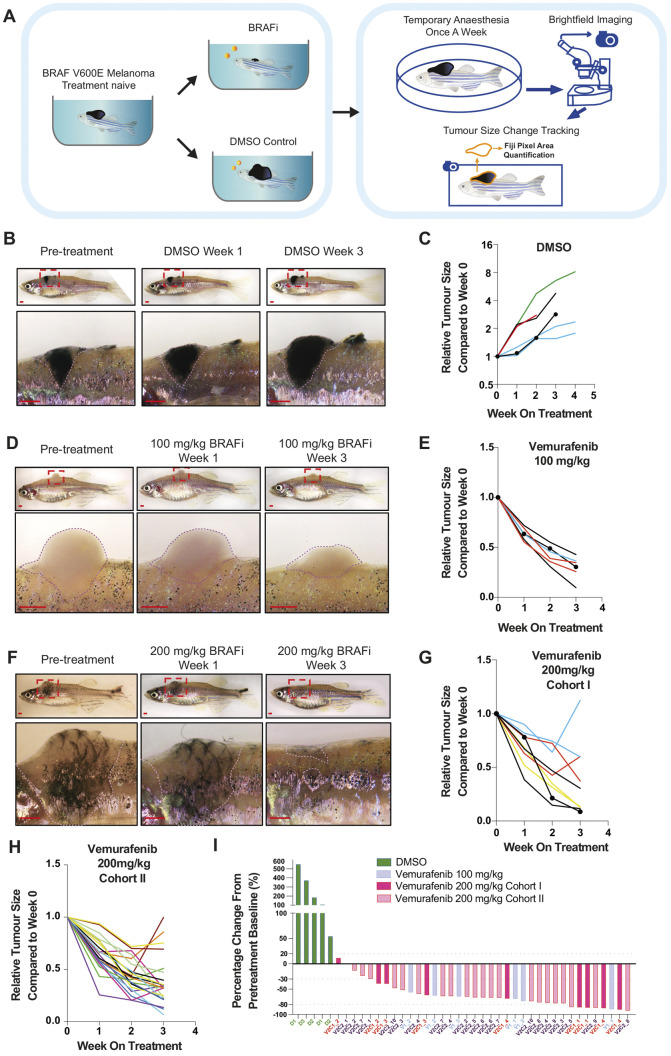
Short-term assessment of vemurafenib pellets on BRAFV600E zebrafish melanoma. (A) Schematic overview of drug-pellet free feeding administration, tumour response tracking and evaluation for each fish treated with vemurafenib or DMSO pellets. (B) Representative images of BRAFV600E zebrafish melanoma progression under treatment with DMSO pellets. Zoomed regions are indicated by red dashed line boxes. Dotted lines outline the melanoma. Scale bars: 1 mm. (C) Quantification of melanoma size change each week (by fold) under treatment with DMSO pellets, comparing to the lesion imaged on the day pre-treatment. Fish receiving DMSO pellets, N=4; lesion count, n=6. Lesions from the same fish are presented in the same colour. The large lesion presented in B is indicated by round dots. (D) Representative images of BRAFV600E zebrafish melanoma regressing under daily treatment with 100 mg/kg vemurafenib pellets. Dotted lines outline the melanoma. Scale bars: 1 mm. (E) Quantification of melanoma size change each week under daily treatment with 100 mg/kg vemurafenib pellets (by fold), compared to pre-treatment. Fish receiving 100 mg/kg vemurafenib pellets, N=3; lesion count, n=6. Lesions from the same fish are presented in the same colour. The lesion presented in D is indicated by round dots. (F) Representative images of BRAFV600E zebrafish melanoma regressing under treatment with 200 mg/kg vemurafenib pellets. Scale bars: 1 mm. (G) Quantification of melanoma size change each week under daily treatment with 200 mg/kg pellets (by fold) for Cohort I, comparing to the lesion imaged on the day pre-treatment. Fish receiving 200 mg/kg vemurafenib pellets, N=4; lesion count, n=9. Lesions from the same fish are presented in the same colour. The lesion presented in F is indicated by round dots. (H) Quantification of melanoma size change each week under daily treatment with 200 mg/kg vemurafenib pellets (by fold) for Cohort II, comparing to the lesion imaged on the day pre-treatment. Fish receiving 200 mg/kg vemurafenib pellets, N=10; lesion count, n=22. Lesions from the same fish are presented in the same colour. (I) Waterfall plot ranking melanoma size change after 3-week daily treatment with DMSO, 100 mg/kg vemurafenib or 200 mg/kg vemurafenib pellets (by percentage), compared to each lesion imaged on the day pre-treatment. Fish receiving DMSO pellets, N=3; lesion count, n=5. Fish receiving 100 mg/kg vemurafenib pellets, N=3; lesion count, n=6. Fish receiving 200 mg/kg vemurafenib pellets (Cohort I), N=4; lesion count, n=9. Fish receiving 200 mg/kg vemurafenib pellets (Cohort II), N=10; lesion count, n=22. Lesions from the same fish are indicated with the same x-axis label. D, DMSO; V1, vemurafenib 100 mg/kg; V2C1, vemurafenib 200 mg/kg Cohort I; V2C2, vemurafenib 200 mg/kg Cohort II.

Acknowledgments
This image is the copyrighted work of the attributed author or publisher, and ZFIN has permission only to display this image to its users. Additional permissions should be obtained from the applicable author or publisher of the image. Full text @ Dis. Model. Mech.