IMAGE

Fig. 3.

ID
ZDB-IMAGE-220521-20
Source
Figures for Lu et al., 2022
Image
Figure Caption

Fig. 3.

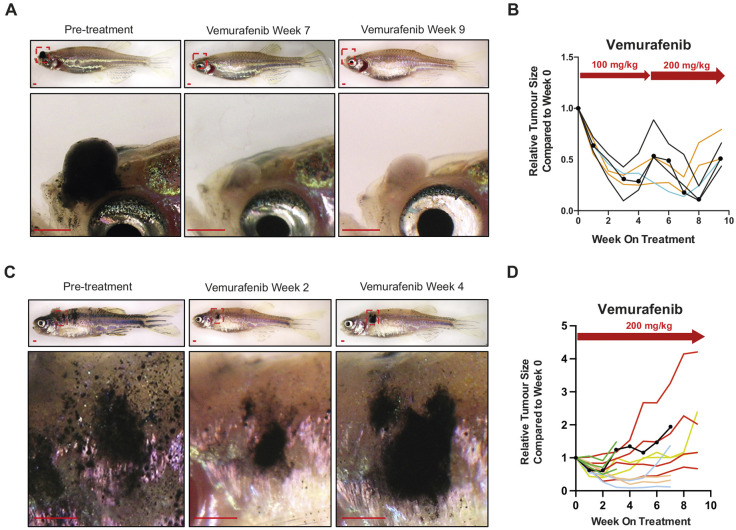
Long-term vemurafenib drug-pellet treatment causes acquired drug resistance in zebrafish melanoma. (A) Representative images of BRAFV600E zebrafish melanoma before treatment, regressed melanoma and progressive disease for the animals shown in B. Scale bars: 1 mm. (B) Quantification of melanoma size change each week under treatment with 100 mg/kg or 200 mg/kg vemurafenib pellets after dose escalation. Fish receiving vemurafenib pellets, N=4; lesion count, n=6. Each coloured line represents one lesion, with the size change tracked over the entire treatment course. Lesions from the same fish share the same colour. The representative lesion shown in A is indicated by round dots. (C) Representative images of BRAFV600E zebrafish melanoma before treatment, during melanoma regression and evidence of recurrent disease while on consistent treatment of 200 mg/kg vemurafenib. Scale bars: 1 mm. (D) Quantification of melanoma size change each week under treatment with 200 mg/kg vemurafenib pellets. Fish receiving vemurafenib pellets, N=6; lesion count, n=14. Each coloured line represents one lesion, with the size change tracked over the entire treatment course. Lesions from the same fish share the same colour. The representative lesion shown in C is indicated by round dots.

Figure Data
Acknowledgments
This image is the copyrighted work of the attributed author or publisher, and ZFIN has permission only to display this image to its users. Additional permissions should be obtained from the applicable author or publisher of the image. Full text @ Dis. Model. Mech.