FIGURE SUMMARY
Title

DaXi-high-resolution, large imaging volume and multi-view single-objective light-sheet microscopy

Authors
Yang, B., Lange, M., Millett-Sikking, A., Zhao, X., Bragantini, J., VijayKumar, S., Kamb, M., Gómez-Sjöberg, R., Solak, A.C., Wang, W., Kobayashi, H., McCarroll, M.N., Whitehead, L.W., Fiolka, R.P., Kornberg, T.B., York, A.G., Royer, L.A.
Source
Full text @ Nat. Methods

Design of a high-resolution, large field of view and multi-view single-objective light-sheet microscope.

a, Simplified scheme of the optical setup. b, In this setup, the light-sheet excitation and emission pass through a single objective. The fluorescence is collected by O1 and relayed downstream with full NA detection, ensuring high-resolution imaging. c, The full NA detection is achieved by oblique remote focusing using a bespoke objective with a monolithic glass tip and zero working distance. The glass tip compresses the collection half-angle allowing a tilt range from 0 to 55°. d, During imaging, the stage moves the sample along the scanning axis. To avoid motion blur, the galvo mirror moves the light sheet alongside the stage movement during the camera exposure for each image. The galvo mirror moves back during the readout time and restarts this compensatory movement during the next exposure. Illumination and detection planes remain centered along the entire optical train to give optimal light collection, minimal aberrations and thus pristine image quality. e, Our instrument is capable of dual light-sheet excitation. This improves illumination coverage and image contrast, as for most points in the sample, one of the two light-sheet orientations will have a shorter penetration depth through the sample giving a more contrasted and complete image. The dual-view imaging is achieved through an imaging flipping module consisting of two galvo mirrors and three normal mirrors along the optical path (f and g). f, The illumination light goes along the path highlighted in orange or blue, resulting in opposing incident angle at the sample space. g, Similarly, the fluorescence light goes through either of the two paths, resulting in the flipping of the image with respect to that of the other path (blue and orange arrows before and after propagation through the unit), ensuring that the intermediate image is always formed on the front surface of O3. h, The microscope is converted from upright (dipping, left side) to inverted (immersion, right side) by repositioning the coverslip from the focal space of O2 to that of O1, without sacrificing the optical performance.

Characterization of the microscope.

a, Imaging volume geometry. The coverslip is parallel to the xy plane. The optical axis of the microscope is along the z axis (depth). The sample is illuminated by an oblique light sheet in the xy plane, where x’ is the light-sheet propagation direction. The field of view in the xy plane is 800 μm (y) by 420 μm (x’), corresponding to 800 μm (y) by 300 μm (depth, z) in the yz plane. Volumetric data were acquired by scanning the sample, along the x axis, with respect to the illumination plane. By using light-sheet stabilized stage scanning, the scanning range (up to 75 mm, compared to 300 μm with galvo scanning) is only limited by the stage. b, Representative PSF obtained by imaging 100-nm green fluorescence beads. Projections along xy, xz and zy are shown. The PSF is slightly tilted and its long axis (z”) is about 20° with respect to the z axis. Taking this into consideration, the line profiles of the PSF were plotted and fitted along the three principal axes, that is x”, y and z”. The FWHM are, respectively, 479.9 ± 28.0, 379.2 ± 20.9 and 1,864.9 ± 174.3 nm (mean ± s.d., n = 156 fluorescence beads). Scale bar, 1 μm.

Large volume imaging of <italic>Danio rerio</italic> larval development and <italic>Drosophila melanogaster</italic> egg chambers.

a, Images of a zebrafish larvae (roughly 30 hpf, nuclei labeled with tg(h2afva:h2afva-mCherry) imaged using the microscope. Imaging volume (x,y,z) is 3,000 × 800 × 300 μm acquired every 50 s (two views). The depth is color-coded, where blue and red indicate respectively close to and far from the coverglass. Scale bar, 100 μm. b, Four xy slices from different regions (1–4, dashed squares in a) at various depths and one xz slice (5, dashed line in a) are highlighted. Scale bar, 50 μm. c, Images of Drosophila fly egg chambers. Nuclei of germline cells (large) and somatic cells (small) were labeled by expressing UAS-NLS-GFP under the control of Usp10-Gal4 (BDSC-76169). Imaging volume is 3,000 × 800 × 180 μm acquired every 30 s (single views) for 3 h. The depth is color-coded as above. Scale bar, 100 μm. d, Four regions (dashed squares in c) are highlighted. Scale bar, 50 μm.

High-speed multi-view imaging of zebrafish tail development.

a, Axial maximum projection showing the whole zebrafish larva tail at 24 hpf, nuclei labeled with tg(h2afva:h2afva-mCherry). Imaging volume is 1,064 × 532 × 287 μm consisting of 4,000 × 2,000 × 360 voxels per view for a total of 5.7 billion voxels acquired every 40 s. Scale bar, 100 μm. b, Side projection illustrating how the two light-sheets enter the sample at 45° to reach a given point in the sample. Depending on the sample geometry and placement, one of the two light-sheets will have a shorter path to reach that point and hence be less susceptible to absorption, refraction or scattering. Consequently, the corresponding view’s image will be more complete and better contrasted. c, Example regions (single xy plane slices) that demonstrate the complementarity of the two views. In some regions (left) the first view has better image quality, whereas in other regions (right) the second view is better. Scale bar, 3 μm. d, After registration, the two views can be fused together to obtain one high-quality image. e, Time-lapse max-projection frames over a 2.2 h period centered on the dorsomedial tail, during which time the boundary between neighboring somites are accentuated. Scale bar, 80 μm. f, Spatio-temporal zoom centered around a cell division, single xy plane slice. Despite the large field of view, both views are acquired every 40 s making it possible to follow the intermediate steps during mitosis—an important capability for achieving, for example, accurate lineage tracking. Scale bar, 10 μm.

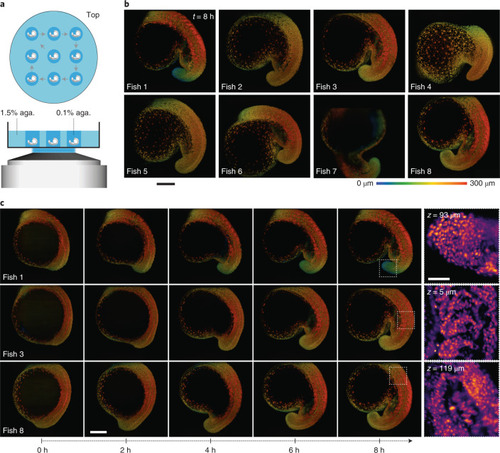
a, Top and side views of nine zebrafish embryos mounted in 0.1% agarose gel. b, The embryos (only eight are shown) were imaged sequentially (at 4.5 min per round) for up to 8 h. Only the final frames at t = 8 h imaging are shown (see also Supplementary Video 6 for the time lapse of all nine embryos). All the embryos developed normally. The images are maximum intensity projection, color-coded for depth, of the 3D volume. Scale bar, 200 μm. c, Five time points from three different fish are shown, illustrating the imaging reproducibility across multiple samples. Scale bars, 50 μm (top right) and 200 μm (bottom left).

Acknowledgments
This image is the copyrighted work of the attributed author or publisher, and ZFIN has permission only to display this image to its users. Additional permissions should be obtained from the applicable author or publisher of the image. Full text @ Nat. Methods