
- Title
-
Two Types of Liposomal Formulations Improve the Therapeutic Ratio of Prednisolone Phosphate in a Zebrafish Model for Inflammation
- Authors
- Xie, Y., Papadopoulou, P., de Wit, B., d'Engelbronner, J.C., van Hage, P., Kros, A., Schaaf, M.J.M.
- Source
- Full text @ Cells
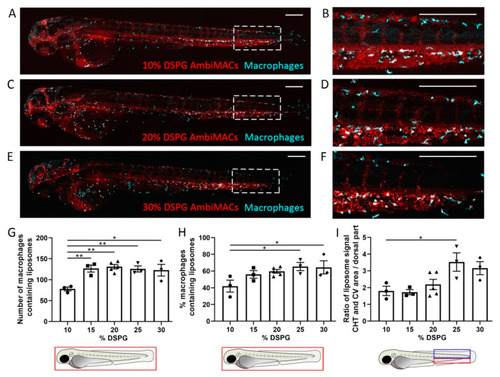
Biodistribution of AmbiMACs with different formulations in zebrafish embryos. (A–F) Representative images of Tg(mpeg1:GFP) embryos injected with AmbiMACs containing different percentages of DSPG at 2 days post-fertilization (dpf). Confocal microscopy images were taken at 2 h post-injection (hpi). AmbiMACs are shown in red and macrophages in cyan. The tail regions (indicated by the dashed boxes in (A,C,E)) are shown at higher magnification in (B,D,F). Scale bar = 200 μm. (G,H) The number (G) and percentage (H) of macrophages containing AmbiMACs quantified in the whole body. A significant difference was observed for the number of macrophages containing AmbiMACs with DSPG percentages of 15–30% compared to 10%. For the percentage of macrophages containing liposomes, a significant difference was observed for AmbiMACs with 25% and 30% DSPG compared to the 10% DSPG. (I) The ratio between the (fluorescent) signal of AmbiMACs in the area, indicated by the red box, encompassing the caudal vein (CV) and the caudal hematopoietic tissue (CHT), and the signal in the dorsal part of the tail (indicated by the blue box). A significant difference was observed between injection with AmbiMACs (25% DSPG) compared to AmbiMACs (10% DSPG). Statistical analysis was performed by one-way ANOVA with Bonferroni’s post hoc test. Data shown are the mean ± SEM of 3–5 individual embryos, of which the individual data are indicated. Statistically significant differences between groups are indicated by: * p < 0.05; ** p < 0.01. |

Biodistribution of liposomes in zebrafish embryos at different stages of development. (A–H) Representative images of embryos of the Tg(mpeg1:GFP) line injected with AmbiMACs (20% DSPG) at 1 (A,B), 2 (C,D), or 3 dpf (E,F) or with PEGylated liposomes at 3 dpf (G,H). Confocal microscopy images were taken at 2 hpi. Liposomes are shown in red and macrophages in cyan. The tail regions (indicated by dashed boxes in (A,C,E,G)) are shown at higher magnification in (B,D,F,H). Scale bar = 200 μm. (I,J). The number (I) and percentage (J) of macrophages containing liposomes quantified in the whole body of embryos injected with AmbiMACs (20% DSPG) at 1, 2, or 3 dpf or with PEGylated liposomes at 3 dpf. Statistical analysis by one-way ANOVA showed a significantly lower number and percentage of macrophages containing liposomes when injected with PEGylated liposomes at 3 dpf, compared to injection with AmbiMACs (20% DSPG). Upon injection with AmbiMACs (20% DSPG), at 1 and 3 dpf, significantly lower numbers of macrophages containing liposomes were observed than at 2 dpf. Embryos at 3 dpf showed significantly lower percentages of macrophages containing liposomes compared to embryos at 1 and 2 dpf. (K) The ratio between the (fluorescent) signal of liposomes in the CHT/CV area and the dorsal part of the tail (as described in Figure 1I). The ratio at 1 dpf was significantly higher compared to 2 and 3 dpf. No significant difference was observed between the AmbiMACs (20% DSPG) and PEG liposomes at 3 dpf. Statistical analysis was performed by one-way ANOVA with Bonferroni’s post hoc test. Data shown are the mean ± SEM of 3–4 individual embryos of which the individual data are indicated. Statistically significant differences between groups are indicated by: ** p < 0.01; *** p < 0.001; **** p < 0.0001. |
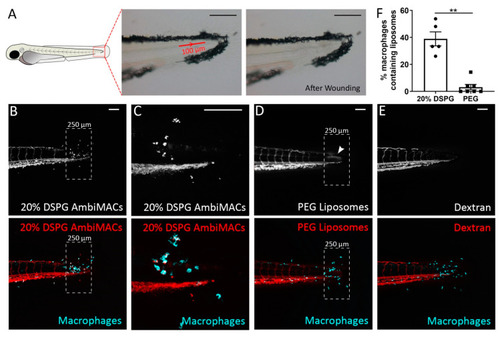
Laser wounding in zebrafish embryos and the subsequent accumulation of liposomes at the wounded site. (A) Schematic drawing of a zebrafish embryo at 3 dpf, and brightfield microscopy images showing the position and size of the area exposed to laser irradiation (red line with arrow indicating the direction of laser) and the damaged tissue after the laser wounding procedure. (B–E) Representative confocal microscopy images of tail regions from 3 dpf embryos of the Tg(mpeg1:GFP) line subjected to laser wounding and injected with AmbiMACs (20% DSPG) (B,C), with (C) at higher magnification), PEGylated liposomes (D), or dextran (2,000,000 MW, (E)). The dashed boxes indicate the area where damage and accumulation of neutrophils were seen. The white arrowhead indicates the accumulation of PEG liposomes (D). Images were taken at 4 h post-wounding (hpw). The dashed box shows the area of quantification. Liposomes are shown in red and macrophages in cyan. Scale bar = 100 μm. (F). The percentage of macrophages containing liposomes in the area near the laser wound (dashed box), in embryos injected with AmbiMACs (20% DSPG) or PEGylated liposomes. A significantly higher percentage of macrophages containing liposomes was observed upon injection with AmbiMACs (20% DSPG). Statistical analysis was performed by two-tailed t-test. Data shown are the mean ± SEM of 5–7 individual embryos, of which the individual data are indicated. Statistically significant differences between groups are indicated by: ** p < 0.01. |

Liposome encapsulation of PLP increased its inhibitory effect on neutrophil recruitment upon laser wounding. Tg(mpx:GFP) embryos (at 3 dpf) were subjected to the laser wounding procedure and injected with different doses of free or liposome-encapsulated PLP, and fluorescence microscopy images were taken at 4 hpw. (A) Schematic drawing of a zebrafish embryo at 3 dpf indicating the area in which the recruited neutrophils were counted (red box). (B) Representative image showing the accumulation of neutrophils (green) near the wound. Scale bar = 100 μm. (C–E) The number of neutrophils recruited to the wounded area at 4 hpw are shown after injection of different doses of free PLP (C), PLP encapsulated in AmbiMACs (20% DSPG) (D), and PLP encapsulated in PEGylated liposomes (E); H2O and empty liposomes were injected as control. Statistical analysis was performed by one-way ANOVA with Bonferroni’s post hoc test. A significant inhibition of the neutrophil migration was observed when embryos had been injected with 5 or 25 pmol of free PLP, 0.2 or 1 pmol of PLP encapsulated in AmbiMACs (20% DSPG) and 1 pmol of PLP encapsulated in PEGylated liposomes. Each data point represents a single embryo, and the means ± SEM of data accumulated from three independent experiments are shown in red. Statistically significant differences between groups are indicated by: ns, non-significant; * p < 0.05; ** p < 0.01; *** p < 0.001. |
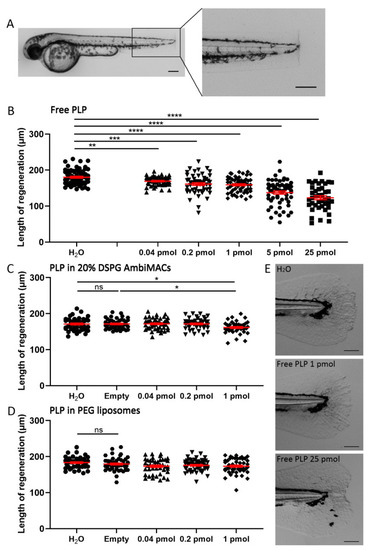
Liposome encapsulation of PLP decreases its inhibitory effect on regeneration of the tail fin after amputation. Embryos (at 2 dpf) were subjected to the tail fin amputation procedure and injected with different doses of free or liposome-encapsulated PLP. (A) Representative image of a 2 dpf zebrafish embryo immediately after amputation, showing the position of the amputated part of the tail fin. Scale bar = 200 μm. (B–D) The length of the regenerated tail fin, measured at 36 h post-amputation (hpa), are shown after injection of different doses of free PLP (B), PLP encapsulated in AmbiMACs (20% DSPG) (C) and PLP encapsulated in PEGylated liposomes (D); H2O and empty liposomes were injected as control. Statistical analysis was performed by one-way ANOVA with Bonferroni’s post hoc test. Significant inhibition of the tail fin regeneration was observed when embryos had been injected with 0.04–25 pmol of free PLP or 1 pmol of PLP encapsulated in AmbiMACs (20% DSPG). No significant inhibition was observed after injection with PLP encapsulated in PEGylated liposomes. Each data point represents a single embryo, and the means ± SEM of the data accumulated from three independent experiments are shown in red. Statistically significant differences between groups are indicated by: ns, non-significant; * p < 0.05; ** p < 0.01; *** p < 0.001; **** p < 0.0001. (E) Representative images of regenerated tail fins at 36 hpa for embryos injected with H2O, 1 pmol PLP, or 25 pmol PLP. Scale bar = 100 μm. |

Liposome encapsulation of PLP decreased its effect on the systemic Gr transactivation activity. Embryos (3 dpf) of the Tg(GRE:GFP) line were injected with free or liposome-encapsulated PLP, and fluorescence microscopy images were taken at 24 hpi. (A) Representative images of Tg(GRE:GFP) embryos injected with H2O or 5 pmol PLP, showing the GFP signal, which is a readout for the transactivation activity of Gr, which increased after PLP injection. Scale bar = 200 μm. (B–C) The quantified GFP signals in the Tg(GRE:GFP) embryos at 24 hpi are shown after injection of different doses of free PLP (B), PLP encapsulated in AmbiMACs (20% DSPG) (C), and PLP encapsulated in PEGylated liposomes (D); H2O and empty liposome were injected as control. Statistical analysis was performed by one-way ANOVA with Bonferroni’s post hoc test. Significant increases in the GFP signal were observed when embryos were injected with 0.2–5 pmol free PLP and 1 pmol of PLP encapsulated in either AmbiMACs (20% DSPG) or in PEGylated liposomes. Each data point represents a single embryo, and the means ± SEM of the data accumulated from three independent experiments are shown in red. Statistically significant differences between groups are indicated by: ns, non-significant; * p < 0.05; **** p < 0.0001. |