
|
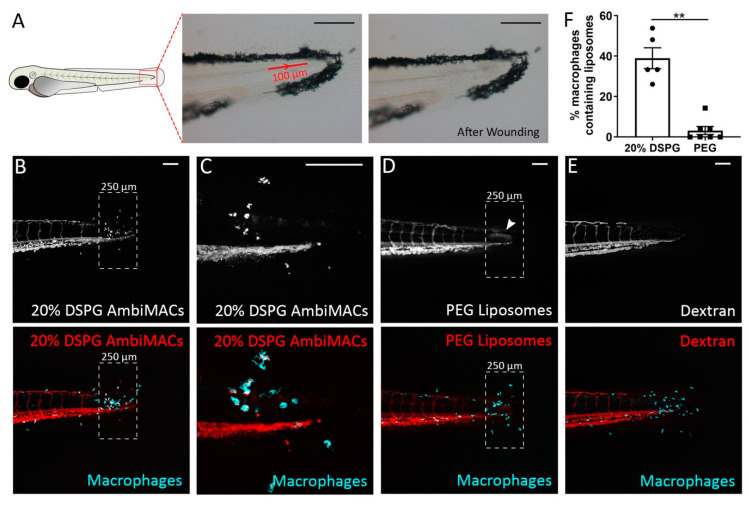
Figure 3
Laser wounding in zebrafish embryos and the subsequent accumulation of liposomes at the wounded site. (A) Schematic drawing of a zebrafish embryo at 3 dpf, and brightfield microscopy images showing the position and size of the area exposed to laser irradiation (red line with arrow indicating the direction of laser) and the damaged tissue after the laser wounding procedure. (B–E) Representative confocal microscopy images of tail regions from 3 dpf embryos of the Tg(mpeg1:GFP) line subjected to laser wounding and injected with AmbiMACs (20% DSPG) (B,C), with (C) at higher magnification), PEGylated liposomes (D), or dextran (2,000,000 MW, (E)). The dashed boxes indicate the area where damage and accumulation of neutrophils were seen. The white arrowhead indicates the accumulation of PEG liposomes (D). Images were taken at 4 h post-wounding (hpw). The dashed box shows the area of quantification. Liposomes are shown in red and macrophages in cyan. Scale bar = 100 μm. (F). The percentage of macrophages containing liposomes in the area near the laser wound (dashed box), in embryos injected with AmbiMACs (20% DSPG) or PEGylated liposomes. A significantly higher percentage of macrophages containing liposomes was observed upon injection with AmbiMACs (20% DSPG). Statistical analysis was performed by two-tailed t-test. Data shown are the mean ± SEM of 5–7 individual embryos, of which the individual data are indicated. Statistically significant differences between groups are indicated by: ** p < 0.01.