
- Title
-
Nonylphenol Polyethoxylates Enhance Adipose Deposition in Developmentally Exposed Zebrafish
- Authors
- Kassotis, C.D., LeFauve, M.K., Chiang, Y.T., Knuth, M.M., Schkoda, S., Kullman, S.W.
- Source
- Full text @ Toxics
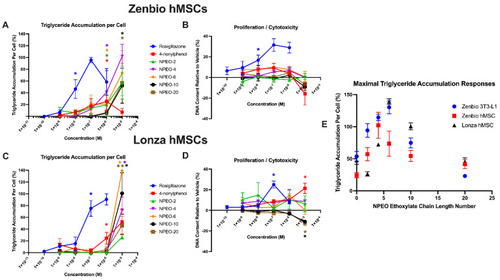
Nonylphenol and polyethoxylates promote adipogenesis in human mesenchymal stem cell models. Zenbio and Lonza human bone marrow–derived mesenchymal stem cell models were differentiated as described in Methods and assessed for adipocyte differentiation (Nile Red staining of lipid accumulation) and cell proliferation (Hoechst staining) after 14/21 (respectively) days of differentiation while exposed to controls chemicals as well as nonylphenol and its ethoxylates. Percent normalized triglyceride accumulation per cell relative to maximal rosiglitazone response (normalized to DNA content) (A,C). increase (cell proliferation) or decrease (potential cytotoxicity) in DNA content relative to vehicle control (B,D). Zenbio–sourced cell data provided in (A,B), and Lonza–sourced cell data provided in (C,D). Data presented as mean ± SEM from three independent experiments. * indicates lowest concentration with significant increase in triglyceride over vehicle control or cell proliferation/cytotoxicity relative to vehicle control, p < 0.05, as per Kruskal–Wallis in GraphPad Prism 9. X–axis format is provided in log scale. Panel (E) provides a summary plot of maximal effects on triglyceride accumulation based on ethoxylate chain length across cell models, comparing results from panels (A,C) with previously published effects in 3T3–L1 cells (PMID: 29106673). NPEO = nonylphenol polyethoxylated (with varying average ethoxylate chain lengths). |
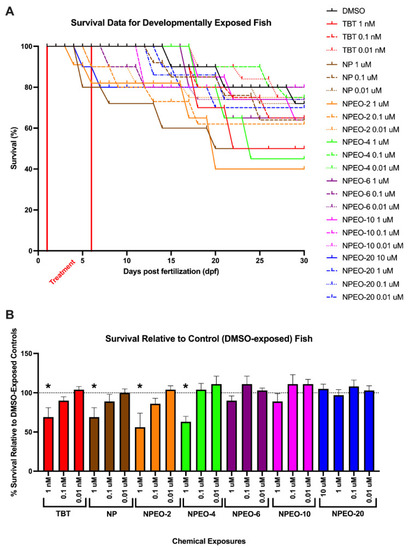
Lethality of nonylphenol and polyethoxylates in developmentally exposed zebrafish. Zebrafish were developmentally exposed to control chemicals, nonylphenol, or nonylphenol polyethoxylates from one through six days post-fertilization. Following exposures, fish were aged to 30 days post-fertilization. Lethality was measured twice daily to determine survivorship across test chemicals and treatments for each test chemical (A). n = 15 replicate fish in each biological replicate (spawning event) for each test chemical and concentration, and four spawns were performed (four biological replicates) and averaged for responses depicted here, for approximately 60 fish evaluated per experimental group. Lethality is depicted in survivorship curves, with decreasing response on the Y axis depicting greater lethality of the test chemicals. Survival percent relative to DMSO vehicle control exposed fish at 30 days (B). * indicates significant change in survival compared to vehicle control fish, p < 0.05, as per Kruskal–Wallis test with Dunn’s multiple comparisons. TBT 10 nM, NP 10 μM, NPEO-2 10 μM, NPEO-4 10 μM, NPEO-6 10 μM, and NPEO-10 10 μM promoted absolute toxicity (no surviving fish) and thus are not depicted here for the purposes of clarity. DMSO = dimethylsulfoxide, vehicle control; TBT = tributyltin chloride; NPEO = nonylphenol polyethoxylated (with varying average ethoxylate chain lengths). PHENOTYPE:
|
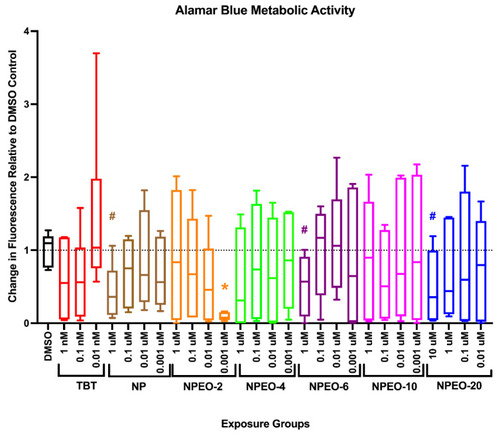
Metabolic activity in zebrafish developmentally exposed to nonylphenol and polyethoxylates. Zebrafish were developmentally exposed to control chemicals, nonylphenol, or nonylphenol polyethoxylates. Immediately following exposure, at six days post-fertilization, metabolic activity was measured using the alamar blue assay. Two groups of three replicate fish were transferred into wells of a 24-well black clear-bottom plate, media removed, and alamar blue solution added to wells. Plates were immediately read for fluorescence, then incubated in the dark for several hours, before measuring fluorescence again. The increase in fluorescence is correlated with increased metabolic activity in the fish. Chemical exposure treated fish responses were compared with dimethylsulfoxide (0.1%, vehicle control) treated fish to determine significant differences. n = 6–9 replicate fish in each biological replicate (spawning event), and three spawns were performed for approximately 24 fish per exposure group. * indicates significant change in arbitrary fluorescence compared to vehicle control fish, p < 0.05, as per Kruskal–Wallis test with Dunn’s multiple comparisons. DMSO = dimethylsulfoxide, vehicle control; TBT = tributyltin chloride; NPEO = nonylphenol polyethoxylated (with varying average ethoxylate chain lengths). # represents p < 0.10, as per statistics described above. Box and whisker plots depict the following metrics: whiskers represent 10–90th percentiles, box bounds represent the 25th to 75th percentiles, and the middle line represents the median. PHENOTYPE:
|
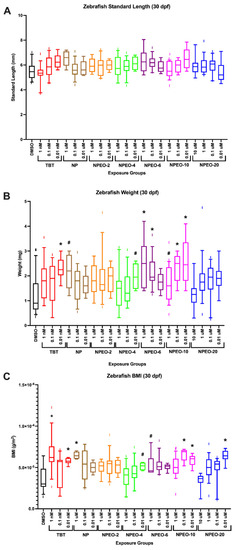
Growth trajectories in zebrafish developmentally exposed to nonylphenol and polyethoxylates. Zebrafish were developmentally exposed to control chemicals, nonylphenol, or nonylphenol polyethoxylates; aged to 30 days post−fertilization; then measured and stained with Nile Red (0.5 μg/mL) for 30 min. Zebrafish were imaged and standard length of each fish was measured (A) using the integrated point−to−point measurement tool within the Leica software, which scales by magnification. Following imaging, zebrafish were blotted with kim wipes and weighed on a microbalance to obtain total body weights (B) for each fish and then averaged across test chemicals and concentrations. Zebrafish body mass index (C) was calculated by dividing the calculated standard length and weights and correcting measurement units to g/m2. n = 24 (DMSO), 16, 21, 25, 15, 20, 24, 14, 21, 25, 15, 25, 27, 22, 28, 25, 22, 27, 26, 25, 23, 26, and 25 across four spawning events (biological replicates) for exposure groups listed below, respectively. * indicates significant increase in total body fluorescence quantification over vehicle control fish, p < 0.05, as per Kruskal–Wallis test with Dunn’s multiple comparisons. DMSO = dimethylsulfoxide, vehicle control; TBT = tributyltin chloride; NPEO = nonylphenol polyethoxylated (with varying average ethoxylate chain lengths). # represents p < 0.10, as per statistics described above. Box and whisker plots depict the following metrics: whiskers represent 10–90th percentiles, box bounds represent the 25th to 75th percentiles, and the middle line represents the median. PHENOTYPE:
|
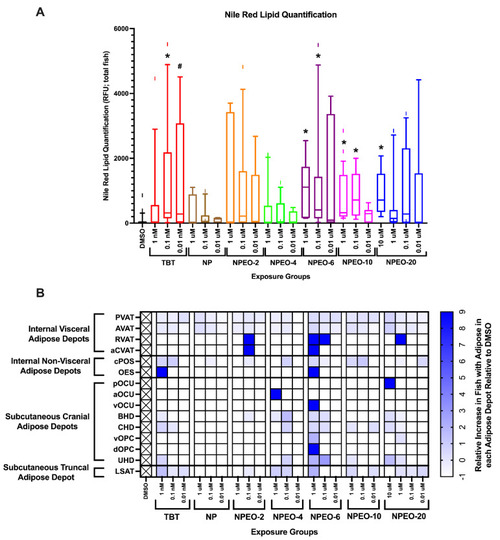
Adipose Deposition in Zebrafish Developmentally Exposed to Nonylphenol and Polyethoxylates. Zebrafish were developmentally exposed to control chemicals, nonylphenol, or nonylphenol polyethoxylates; aged to 30 days post-fertilization; then measured and stained with Nile Red (0.5 μg/mL) for 30 min. Total body fluorescence (A) was imaged at 16× magnification using a yellow fluorescent protein filter (representative images in Figure 6) and fluorescence was quantified for each fish and then biological replicates were averaged. n = 24 (DMSO), 16, 21, 25, 15, 20, 24, 14, 21, 25, 15, 25, 27, 22, 28, 25, 22, 27, 26, 25, 23, 26, and 25 across four spawning events (biological replicates) for exposure groups listed below, respectively. * indicates significant increase in total body fluorescence quantification over vehicle control fish, p < 0.05, as per Kruskal–Wallis test with Dunn’s multiple comparisons. # represents p < 0.10, as per statistics described above. Box and whisker plots depict the following metrics: whiskers represent 10–90th percentiles, box bounds represent the 25th to 75th percentiles, and the middle line represents the median. Developmental trajectory of adipose depots across the zebrafish (B). Relative proportions of fish exhibiting fluorescing adipocytes in each depot in the DMSO fish were set as “normal” and the heat map depicts increased proportions of fish in each group with visible adipocytes in each depot. Adipose depots labeled as per the developmental guides provided in Minchin and Rawls, 2017 (PMID: 28348140) and grouped based on anatomical classifications. A value of 9 represents a 9X increase in the proportion of fish in an exposure group PVAT = pancreatic visceral adipose tissue; AVAT = abdominal visceral adipose tissue; RVAT = renal visceral adipose tissue; aCVAT = anterior cardiac visceral adipose tissue; cPOS = central paraosseal non-visceral adipose tissue; OES = esophageal non-visceral adipose tissue; LSAT = lateral truncal adipose tissue; pOCU = posterior ocular adipose tissue; aOCU = anterior ocular adipose tissue; vOCU = ventral ocular adipose tissue; BHD = basihyal hyoid adipose tissue; CHD = ceratohyal hyoid adipose tissue; vOPC = ventral opercular adipose tissue; dOPC = dorsal opercular adipose tissue; and UHD = urihyal hyoid adipose tissue. DMSO = dimethylsulfoxide, vehicle control; TBT = tributyltin chloride; NPEO = nonylphenol polyethoxylated (with varying average ethoxylate chain lengths). PHENOTYPE:
|
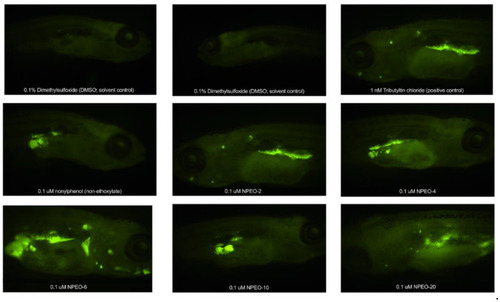
Adipose Patterning in Zebrafish Developmentally Exposed to Nonylphenol and Polyethoxylates. Representative fluorescent images of developmentally exposed zebrafish exposed to control chemicals, nonylphenol, and the nonylphenol polyethoxylates. Anesthetized fish imaged at 30 days post-fertilization, following a 30 min stain (0.5 μg/mL Nile Red). Images obtained at 16× magnification using a yellow fluorescent protein filter. DMSO = dimethylsulfoxide, vehicle control; TBT = tributyltin chloride; NPEO = nonylphenol polyethoxylated (with varying average ethoxylate chain lengths). PHENOTYPE:
|