
|
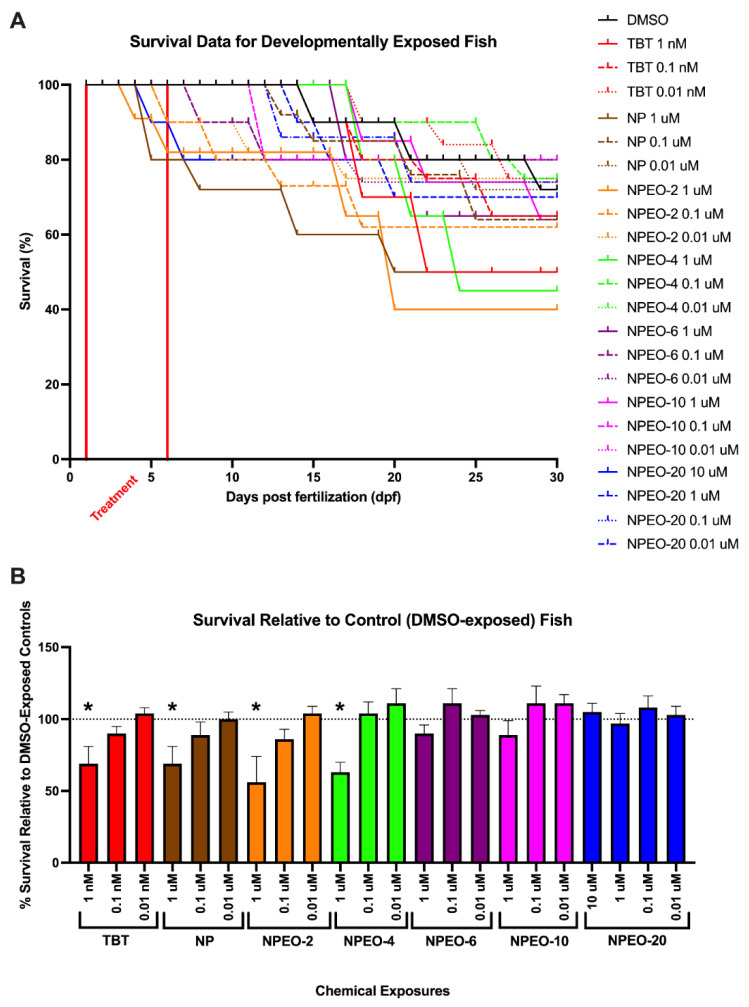
Figure 2
Lethality of nonylphenol and polyethoxylates in developmentally exposed zebrafish. Zebrafish were developmentally exposed to control chemicals, nonylphenol, or nonylphenol polyethoxylates from one through six days post-fertilization. Following exposures, fish were aged to 30 days post-fertilization. Lethality was measured twice daily to determine survivorship across test chemicals and treatments for each test chemical (A). n = 15 replicate fish in each biological replicate (spawning event) for each test chemical and concentration, and four spawns were performed (four biological replicates) and averaged for responses depicted here, for approximately 60 fish evaluated per experimental group. Lethality is depicted in survivorship curves, with decreasing response on the Y axis depicting greater lethality of the test chemicals. Survival percent relative to DMSO vehicle control exposed fish at 30 days (B). * indicates significant change in survival compared to vehicle control fish, p < 0.05, as per Kruskal–Wallis test with Dunn’s multiple comparisons. TBT 10 nM, NP 10 μM, NPEO-2 10 μM, NPEO-4 10 μM, NPEO-6 10 μM, and NPEO-10 10 μM promoted absolute toxicity (no surviving fish) and thus are not depicted here for the purposes of clarity. DMSO = dimethylsulfoxide, vehicle control; TBT = tributyltin chloride; NPEO = nonylphenol polyethoxylated (with varying average ethoxylate chain lengths).