
|
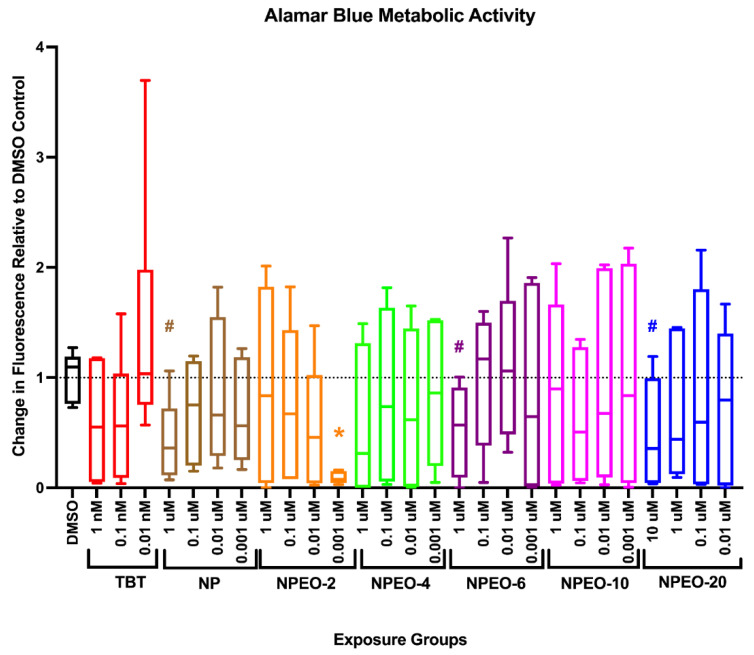
Figure 3
Metabolic activity in zebrafish developmentally exposed to nonylphenol and polyethoxylates. Zebrafish were developmentally exposed to control chemicals, nonylphenol, or nonylphenol polyethoxylates. Immediately following exposure, at six days post-fertilization, metabolic activity was measured using the alamar blue assay. Two groups of three replicate fish were transferred into wells of a 24-well black clear-bottom plate, media removed, and alamar blue solution added to wells. Plates were immediately read for fluorescence, then incubated in the dark for several hours, before measuring fluorescence again. The increase in fluorescence is correlated with increased metabolic activity in the fish. Chemical exposure treated fish responses were compared with dimethylsulfoxide (0.1%, vehicle control) treated fish to determine significant differences. n = 6–9 replicate fish in each biological replicate (spawning event), and three spawns were performed for approximately 24 fish per exposure group. * indicates significant change in arbitrary fluorescence compared to vehicle control fish, p < 0.05, as per Kruskal–Wallis test with Dunn’s multiple comparisons. DMSO = dimethylsulfoxide, vehicle control; TBT = tributyltin chloride; NPEO = nonylphenol polyethoxylated (with varying average ethoxylate chain lengths). # represents p < 0.10, as per statistics described above. Box and whisker plots depict the following metrics: whiskers represent 10–90th percentiles, box bounds represent the 25th to 75th percentiles, and the middle line represents the median.