
Figure 4
- ID
- ZDB-FIG-220302-106
- Publication
- Kassotis et al., 2022 - Nonylphenol Polyethoxylates Enhance Adipose Deposition in Developmentally Exposed Zebrafish
- Other Figures
- All Figure Page
- Back to All Figure Page
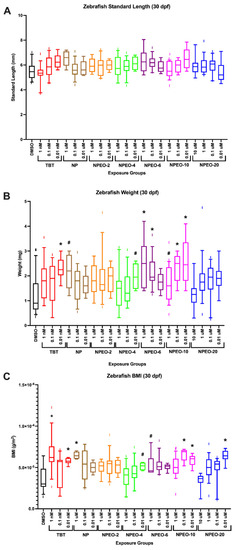
Growth trajectories in zebrafish developmentally exposed to nonylphenol and polyethoxylates. Zebrafish were developmentally exposed to control chemicals, nonylphenol, or nonylphenol polyethoxylates; aged to 30 days post−fertilization; then measured and stained with Nile Red (0.5 μg/mL) for 30 min. Zebrafish were imaged and standard length of each fish was measured (A) using the integrated point−to−point measurement tool within the Leica software, which scales by magnification. Following imaging, zebrafish were blotted with kim wipes and weighed on a microbalance to obtain total body weights (B) for each fish and then averaged across test chemicals and concentrations. Zebrafish body mass index (C) was calculated by dividing the calculated standard length and weights and correcting measurement units to g/m2. n = 24 (DMSO), 16, 21, 25, 15, 20, 24, 14, 21, 25, 15, 25, 27, 22, 28, 25, 22, 27, 26, 25, 23, 26, and 25 across four spawning events (biological replicates) for exposure groups listed below, respectively. * indicates significant increase in total body fluorescence quantification over vehicle control fish, p < 0.05, as per Kruskal–Wallis test with Dunn’s multiple comparisons. DMSO = dimethylsulfoxide, vehicle control; TBT = tributyltin chloride; NPEO = nonylphenol polyethoxylated (with varying average ethoxylate chain lengths). # represents p < 0.10, as per statistics described above. Box and whisker plots depict the following metrics: whiskers represent 10–90th percentiles, box bounds represent the 25th to 75th percentiles, and the middle line represents the median. |
| Fish: | |
|---|---|
| Conditions: | |
| Observed In: | |
| Stage Range: | Prim-5 to Days 21-29 |