
- Title
-
Evaluation of cytogenotoxic potential and embryotoxicity of KRS-Cauvery River water in zebrafish (Danio rerio)
- Authors
- Anifowoshe, A.T., Roy, D., Dutta, S., Nongthomba, U.
- Source
- Full text @ Ecotoxicol. Environ. Saf.
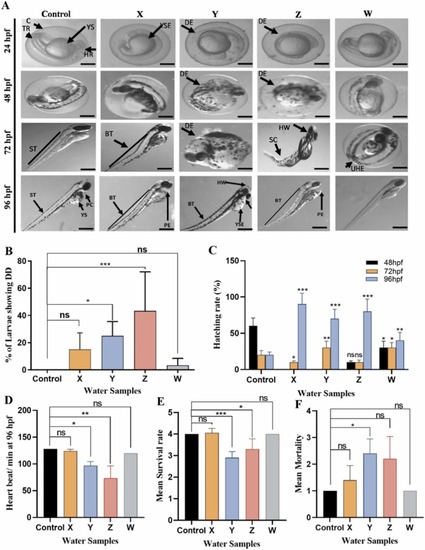
Fig. 1. Developmental toxicity test shows that KRS-CR water can induce heartbeat, hatching rate, developmental defects and mortality in zebrafish. A. The Control, and test samples X, Y, Z and W show various phenotypic alterations in zebrafish (24–96 hpf). B. Quantification of various anomalies observed in the zebrafish. C. Rate of heartbeat per minute in zebrafish larvae at 96 hpf in both control and test samples. D. Hatching rate (%) at 48–96 hpf. E. and F. Mean survival and mortality rates observed in both control and test samples. *p < 0.05; **p < 0.01; ***p < 0.001. ns: not significant. DD: Developmental Defects. |
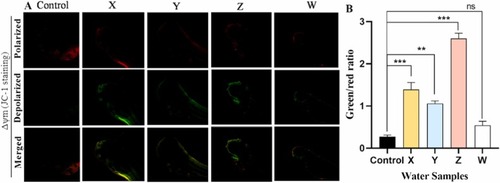
Fig. 2. Measurement of Mitochondrial membrane potential using JC-1 dye in 96-hpf zebrafish embryos shows mitochondrial depolarization in the test samples compared to control. A. Confocal microscopy images show mitochondrial membrane potential (ΔΨm) in control and treated (X, Y, Z and W) embryos (Mag. × 10). B. Quantitative analysis of the zebrafish embryos stained with JC-1 dye at 96 hpf. Mitochondrial depolarization (damaged state) or polarization (healthy state) are revealed by a decrease or increase in the green/red fluorescence intensity ratio respectively. Values are shown as mean ± SD, n = 15. **p < 0.01; ***p < 0.001; ns: not significant. |
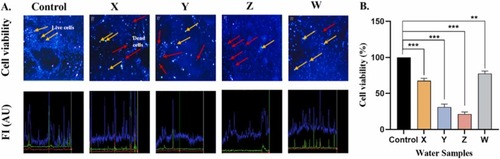
Fig. 3. KRS-CR water causes reduce cell viability. A. Cell viability analyzed by Trypan blue exclusion measured using fluorescence microscope (Mag. × 10). The intensity of the viable and non-viable cells is shown below each group. Orange arrows indicate live cells (viable) and red arrows indicate dead cells (non-viable). B. The intensity of the live cells reduced drastically in Y and Z. **p < 0.01; ***p < 0.001. FI: Fluorescent Intensity (AU: Arbitrary unit). |
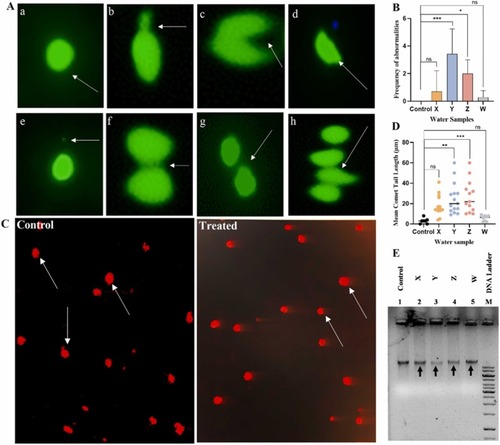
Fig. 4. Genotoxic test shows induction of micronuclei, nuclear anomalies and DNA damage by the KRS-CR Water. A. Micronuclei (MN) and other nuclear abnormalities (NA) (blebbed, reniform, deformed, nucleoplasmic bridge, binucleated and multinucleated observed in treated groups (X, Y and W) zebrafish embryos stained with AO dye at 96 hpf. (Mag. × 60). B. Quantitative analysis of MN and NA observed in zebrafish embryos at 96 hpf. *p < 0.05; p < 0.001. C. DNA damage evaluated by single cell gel electrophoresis (comet assay) (Mag. × 10) in both control and treated groups. D. Quantification of the water samples from Y and Z sites shows significant induction of DNA strand breaks as indicated by comet tail. **p < 0.01; ***p < 0.001; ns: not significant. E. Agarose gel electrophoresis of genomic DNA exposed to the water samples. The genomic DNA of the Y and Z are becoming fragmented, thus fading when compared to the control (Black arrows). a – Normal Nucleus; b – Blebbed Nucleus; c– Reniform Nucleus; d – Deformed Nucleus; e – Micronucleus; f – Nucleoplasmic Bridge; g – Binucleated; h – Multinucleated. |

Fig. 5. Summary of the experiments. KRS-CR water induces developmental defects in zebrafish by increasing apoptosis through oxidative stress and destruction of cellular organelles. It enhances the production of reactive oxygen species (ROS), which causes oxidative stress, mitochondrial dysfunction, and DNA damage, leading to apoptotic cell death and developmental defects, primarily skeletal deformities and pericardial edema in zebrafish. |