
IMAGE
Fig. 3
- ID
- ZDB-IMAGE-220822-64
- Publication
- Anifowoshe et al., 2022 - Evaluation of cytogenotoxic potential and embryotoxicity of KRS-Cauvery River water in zebrafish (Danio rerio)
- All Figures
- Figures for Anifowoshe et al., 2022
Image
|
Figure Caption
Fig. 3
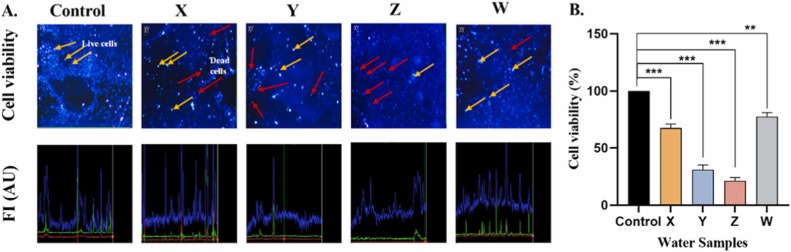
Fig. 3. KRS-CR water causes reduce cell viability. A. Cell viability analyzed by Trypan blue exclusion measured using fluorescence microscope (Mag. × 10). The intensity of the viable and non-viable cells is shown below each group. Orange arrows indicate live cells (viable) and red arrows indicate dead cells (non-viable). B. The intensity of the live cells reduced drastically in Y and Z. **p < 0.01; ***p < 0.001. FI: Fluorescent Intensity (AU: Arbitrary unit).
Acknowledgments
This image is the copyrighted work of the attributed author or publisher, and
ZFIN has permission only to display this image to its users.
Additional permissions should be obtained from the applicable author or publisher of the image.
Full text @ Ecotoxicol. Environ. Saf.