
Fig. 2
- ID
- ZDB-IMAGE-220822-63
- Publication
- Anifowoshe et al., 2022 - Evaluation of cytogenotoxic potential and embryotoxicity of KRS-Cauvery River water in zebrafish (Danio rerio)
- All Figures
- Figures for Anifowoshe et al., 2022
|
Fig. 2
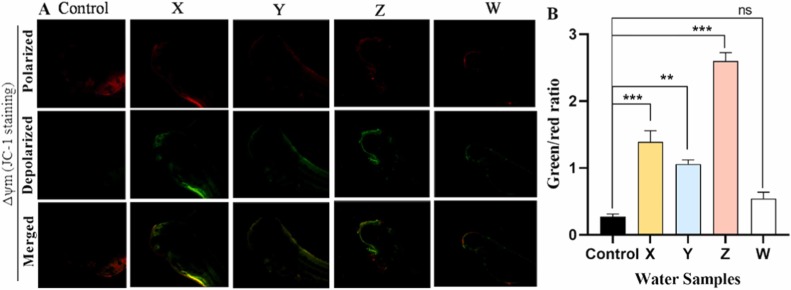
Fig. 2. Measurement of Mitochondrial membrane potential using JC-1 dye in 96-hpf zebrafish embryos shows mitochondrial depolarization in the test samples compared to control. A. Confocal microscopy images show mitochondrial membrane potential (ΔΨm) in control and treated (X, Y, Z and W) embryos (Mag. × 10). B. Quantitative analysis of the zebrafish embryos stained with JC-1 dye at 96 hpf. Mitochondrial depolarization (damaged state) or polarization (healthy state) are revealed by a decrease or increase in the green/red fluorescence intensity ratio respectively. Values are shown as mean ± SD, n = 15. **p < 0.01; ***p < 0.001; ns: not significant.