
- Title
-
α-Conotoxin TxIB Improved Behavioral Abnormality and Changed Gene Expression in Zebrafish (Danio rerio) Induced by Alcohol Withdrawal
- Authors
- Mao, K., Li, X., Chen, Z., Dong, X., Zhangsun, D., Zhu, X., Luo, S.
- Source
- Full text @ Front Pharmacol

The behavior profile of zebrafish in the open field test. Lyophilized TxIB was dissolved in normal saline solution (0.9%) and then injected at 10 μL per fish for a final concentration of 1 mg/kg using the retro-orbital injection method. The control and withdrawal groups were injected with 10 μL of normal saline solution per fish to serve as controls. (A) The diagram of the open field test with individual fish, the tank was divided into two equal virtual zones, center and periphery; (B) The max speed in the center zone; (C) The global activity in the center zone; (D) Representative trajectory chart of individual fish in the open field apparatus. Data represented as mean ± SEM (30 zebrafish per group). * indicates p < 0.05, # indicates p is between 0.05 and 0.1 (one-way ANOVA followed by Tukey’s multiple comparisons test was performed). |
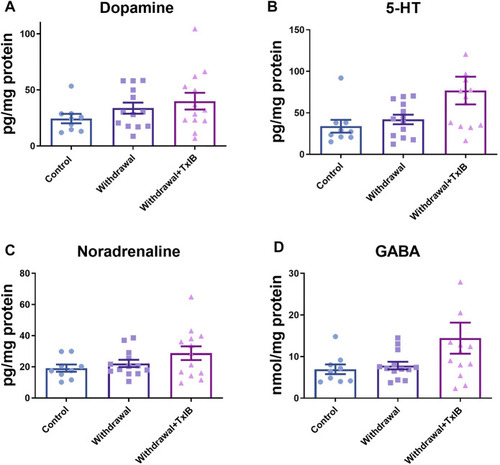
Monoamine neurotransmitter content in the whole zebrafish brain; (A) Dopamine content; (B) 5-HT content; (C) Noradrenaline content; (D) GABA content. TxIB concentration of 1 mg/kg was used. Data are mean ± SEM of 9–13 zebrafish per group. One-way ANOVA followed by Tukey’s multiple comparisons test was performed |
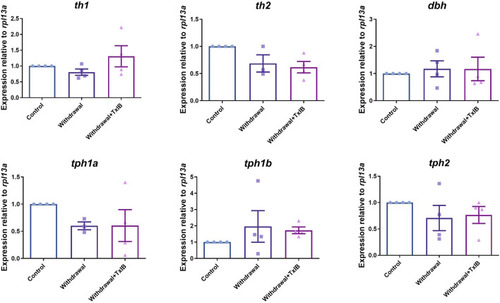
mRNA expression of rate-limiting enzymes in the synthesis of monoamine neurotransmitters, th1, th2 are two isoforms of the rate-limiting enzyme of dopamine synthesis, dbh is the rate-limiting enzyme of noradrenaline synthesis, tph1a, tph1b, and tph2 are three isoforms of the rate-limiting enzyme of 5-HT synthesis. TxIB concentration of 1 mg/kg was used. Data are mean ± SEM of 4 zebrafish per group. One-way ANOVA followed by Tukey’s multiple comparisons test was performed. |

RNA sequencing results; (A) Venn diagram of overlapped genes between control vs withdrawal (G0) and withdrawal vs withdrawal + TxIB (G2) datasets; (B) Heatmap of expression of overlapped 225 genes (“C” indicates Control group, “W” indicates alcohol withdrawal group, “T” indicates withdrawal + TxIB group); (C) Gene Ontology enrichment of overlapped 225 genes. MF: molecular function CC: cellular component BP: biological process; (D) KEGG pathway enrichment of overlapped 225 genes. |

The relative expression profile of genes enriched in the calcium signaling pathway. Data are mean ± SEM of 3 samples per group. * indicates p < 0.05, ** indicates p < 0.01 (one-way ANOVA followed by Tukey’s multiple comparisons test). |
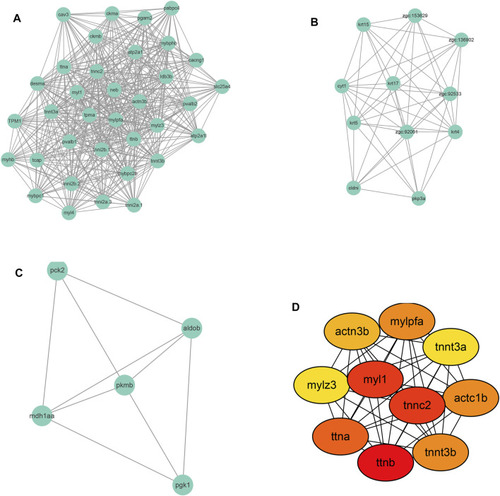
Module screening (A–C) and hub gene screening (D) from Protein-protein interaction network. |

The expression level of genes in calcium signaling and cardiac muscle contraction pathway using RT-PCR. TxIB concentration of 1 mg/kg was used. Data are mean ± SEM of 3 samples per group. * indicates p < 0.05, ** indicates p < 0.01 (one-way ANOVA followed by Tukey’s multiple comparisons test). |

KEGG map of the calcium signaling pathway. The red and green boxes indicate the up-regulated and down-regulated proteins through TxIB administration. |