
Image
|
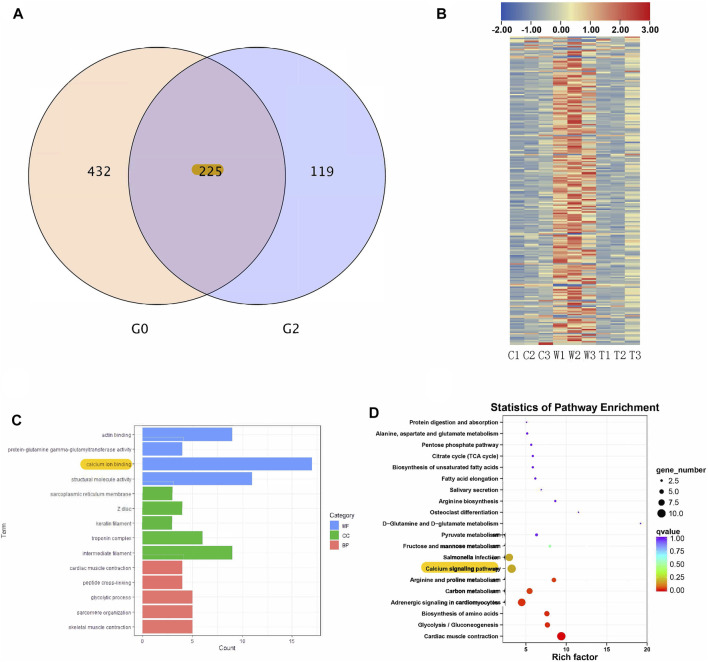
Figure Caption
FIGURE 4 RNA sequencing results; (A) Venn diagram of overlapped genes between control vs withdrawal (G0) and withdrawal vs withdrawal + TxIB (G2) datasets; (B) Heatmap of expression of overlapped 225 genes (“C” indicates Control group, “W” indicates alcohol withdrawal group, “T” indicates withdrawal + TxIB group); (C) Gene Ontology enrichment of overlapped 225 genes. MF: molecular function CC: cellular component BP: biological process; (D) KEGG pathway enrichment of overlapped 225 genes.
Acknowledgments
This image is the copyrighted work of the attributed author or publisher, and
ZFIN has permission only to display this image to its users.
Additional permissions should be obtained from the applicable author or publisher of the image.
Full text @ Front Pharmacol