
|
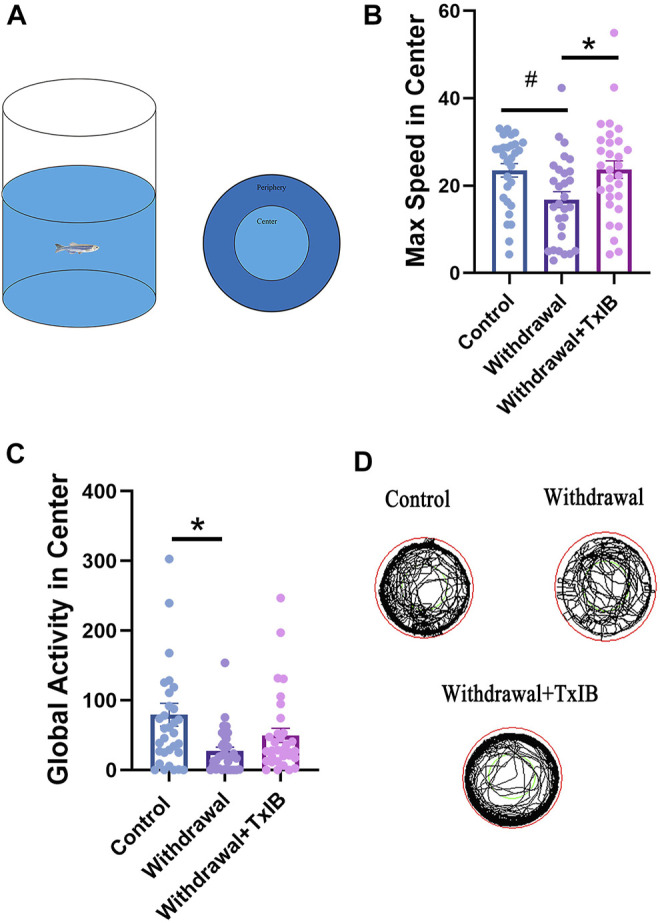
FIGURE 1 The behavior profile of zebrafish in the open field test. Lyophilized TxIB was dissolved in normal saline solution (0.9%) and then injected at 10 μL per fish for a final concentration of 1 mg/kg using the retro-orbital injection method. The control and withdrawal groups were injected with 10 μL of normal saline solution per fish to serve as controls. (A) The diagram of the open field test with individual fish, the tank was divided into two equal virtual zones, center and periphery; (B) The max speed in the center zone; (C) The global activity in the center zone; (D) Representative trajectory chart of individual fish in the open field apparatus. Data represented as mean ± SEM (30 zebrafish per group). * indicates p < 0.05, # indicates p is between 0.05 and 0.1 (one-way ANOVA followed by Tukey’s multiple comparisons test was performed).