
Image
|
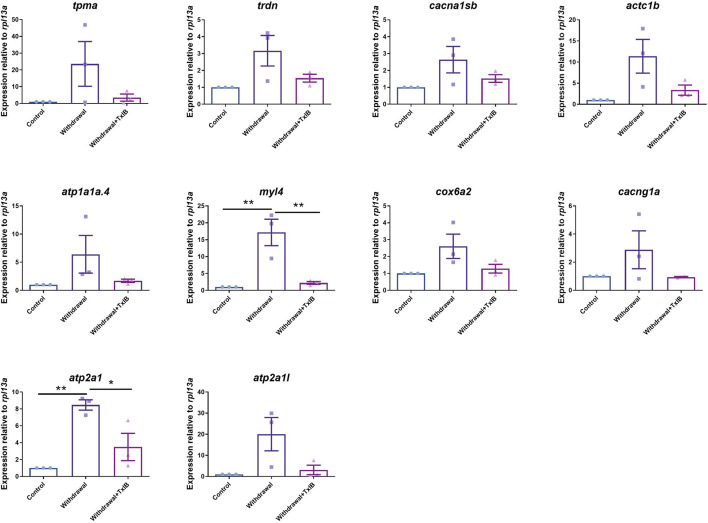
Figure Caption
FIGURE 7 The expression level of genes in calcium signaling and cardiac muscle contraction pathway using RT-PCR. TxIB concentration of 1 mg/kg was used. Data are mean ± SEM of 3 samples per group. * indicates p < 0.05, ** indicates p < 0.01 (one-way ANOVA followed by Tukey’s multiple comparisons test).
Acknowledgments
This image is the copyrighted work of the attributed author or publisher, and
ZFIN has permission only to display this image to its users.
Additional permissions should be obtained from the applicable author or publisher of the image.
Full text @ Front Pharmacol