
- Title
-
Establishment of developmental gene silencing by ordered polycomb complex recruitment in early zebrafish embryos
- Authors
- Hickey, G.J., Wike, C.L., Nie, X., Guo, Y., Tan, M., Murphy, P.J., Cairns, B.R.
- Source
- Full text @ Elife
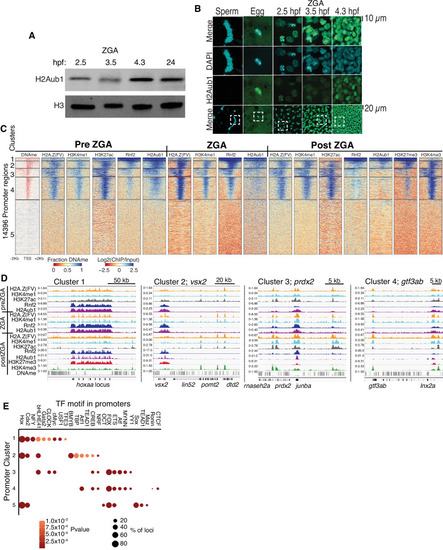
(A) Detection of H2Aub1 and histone H3 (control) by western blot, prior to (2.5 hr post fertilization [hpf]), during (3.5 hpf), following (4.3 hpf) zygotic genome activation (ZGA), and 24 hpf. (B) Nuclear H2Aub1 immunofluorescence in zebrafish sperm, oocytes (egg), and embryos prior to (2.5 hpf), during (3.5 hpf), and following (4.3 hpf) ZGA. Dashed square: field of view in upper panels. (C) K-means clustering of DNA methylation (DNAme) and chromatin immunoprecipitation (ChIP)-seq (histone modifications/variant) at promoters (UCSC refseq). For DNAme, red color indicates regions that lack DNAme. (D) Genome browser screenshots of ChIP-seq enrichment at representative genes from the clusters in panel (C). (E) Transcription factor motif enrichment from HOMER (Heinz et al., 2010) at promoter clusters from (C).
|

(A) K-means clustering of whole genome bisulfite sequencing (WGBS) (for DNAme) and chromatin immunoprecipitation (ChIP)-seq at enhancers (postzygotic genome activation [postZGA] H3K4me1 peak summits located outside of promoters). DNAme heatmap displays WGBS fraction-methylated scores (note: red color indicates regions that lack DNAme). ChIP-seq heatmaps display log2(ChIP/input) scores. (B) Genome browser screenshots of ChIP-seq enrichment at representative loci from the indicated K-means clusters in (A). (C) Transcription factor motif enrichment from HOMER (Heinz et al., 2010) at enhancer clusters from (A). (D) Features of an enhancer cluster with exceptionally high H3K27ac and Nanog binding. K-means clusters generated in (A) were utilized to plot heatmaps of Nanog and H3K27ac. (E) A genome browser screenshot depicting Nanog and H3K27ac ChIP enrichment at a DNA-methylated enhancer from cluster 5 in (D).
|
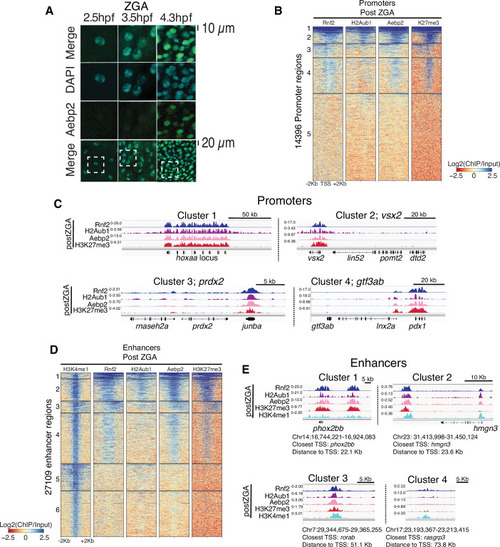
(A) Nuclear Aebp2 detection by immunofluorescence in postzygotic genome activation (postZGA) zebrafish embryos (4.3 hr post fertilization [hpf]). No Aebp2 staining was detected at preZGA (2.5 hpf) or ZGA (3.5 hpf). Bottom row: The dashed square indicates the field of view in upper panels. One of three biological replicates is shown. (B) Aebp2 binding at promoters during postZGA overlaps and scales with occupancy of Rnf2, H2Aub1, and H3K27me3. Promoter clusters from Figure 1C were utilized to plot heatmaps. (C) Genome browser screenshots of chromatin immunoprecipitation (ChIP)-seq at representative promoter loci from clusters in (B). (D) Aebp2 binding at enhancers during postZGA overlaps with occupancy of Rnf2, H2Aub1, and H3K27me3. Enhancer clusters from Figure 2A were utilized to plot heatmaps. (E) Genome browser screenshots of ChIP-seq enrichment at representative enhancer loci from clusters in (D).
|
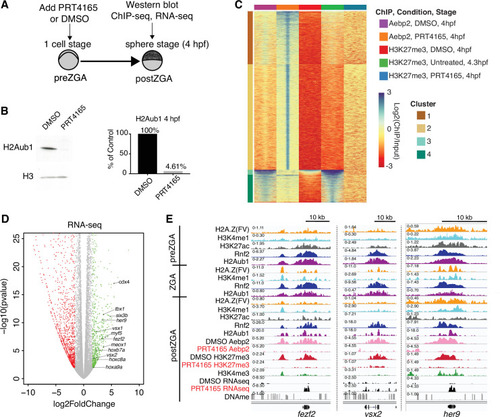
(A) Experimental design of drug treatments to inhibit Rnf2 activity. Embryos at the one-cell stage were added to media containing either PRT4165 (150 μM) or DMSO and raised until 4 hr post fertilization (hpf). (B) PRT4165 treatment of embryos confers bulk loss of H2Aub1 at 4 hpf. Left: Western blot for H2Aub1 in 4 hpf embryos treated with DMSO (vehicle) or 150 μM PRT4165 (Rnf2 inhibitor). Right: Quantification western blot in left panel. (C) Impact of Rnf2 inhibition on Aebp2 genomic localization and H3K27me3. K-means clustering of Aebp2 and H3K27me3 chromatin immunoprecipitation (ChIP)-seq enrichment at all loci with called peaks in any of the datasets plotted. Embryos were treated from the one-cell stage with either DMSO or 150 μM PRT4165 and harvested at 4 hpf for ChIP analysis. H3K27me3 ChIP-seq from untreated embryos at 4.3 hpf is plotted as a comparitor. (D) Impact of Rnf2 inhibition on gene expression. Volcano plot of RNA-seq data from PRT4165-treated vs. untreated embryos (4 hpf). Green and red data points signify transcripts with p-values < 0.01 and at least a 3-fold change (increase or decrease) in expression, respectively. Marquee upregulated genes encoding developmental transcription factors are labelled. (E) Genome browser screenshots of representative developmental genes which, upon Rnf2 inhibition, lose Aebp2 binding and H3K27me3 marking, and become transcriptionally active.
|
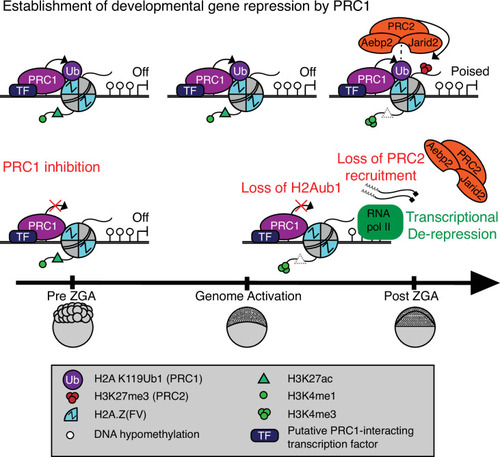
Prior to zygotic genome activation (ZGA), Rnf2-PRC1 is recruited by transcription factors (TFs) to promoters (shown) and enhancers (not shown) of developmental genes bearing Placeholder nucleosomes (H2A.Z(FV), H3K4me1, H3K27ac). Rnf2-PRC1 deposition of H2Aub1 recruits Aebp2-PRC2 to catalyze H3K27me3 addition. H2Aub1 ablation (via Rnf2 inhibition) eliminates Aebp2-PRC2 recruitment and prevents H3K27me3 establishment. Notably, H2Aub1 loss causes precocious transcription of certain developmental genes after ZGA, identifying H2Aub1 as a critical component of silencing at ZGA.
|