
Figure 4
- ID
- ZDB-IMAGE-220131-590
- Publication
- Hickey et al., 2022 - Establishment of developmental gene silencing by ordered polycomb complex recruitment in early zebrafish embryos
- All Figures
- Figures for Hickey et al., 2022
|
Figure 4
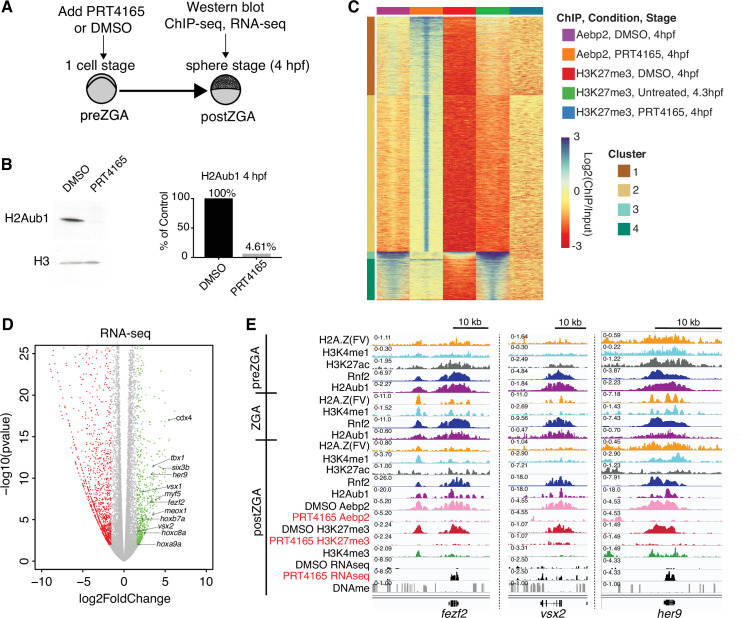
(A) Experimental design of drug treatments to inhibit Rnf2 activity. Embryos at the one-cell stage were added to media containing either PRT4165 (150 μM) or DMSO and raised until 4 hr post fertilization (hpf). (B) PRT4165 treatment of embryos confers bulk loss of H2Aub1 at 4 hpf. Left: Western blot for H2Aub1 in 4 hpf embryos treated with DMSO (vehicle) or 150 μM PRT4165 (Rnf2 inhibitor). Right: Quantification western blot in left panel. (C) Impact of Rnf2 inhibition on Aebp2 genomic localization and H3K27me3. K-means clustering of Aebp2 and H3K27me3 chromatin immunoprecipitation (ChIP)-seq enrichment at all loci with called peaks in any of the datasets plotted. Embryos were treated from the one-cell stage with either DMSO or 150 μM PRT4165 and harvested at 4 hpf for ChIP analysis. H3K27me3 ChIP-seq from untreated embryos at 4.3 hpf is plotted as a comparitor. (D) Impact of Rnf2 inhibition on gene expression. Volcano plot of RNA-seq data from PRT4165-treated vs. untreated embryos (4 hpf). Green and red data points signify transcripts with p-values < 0.01 and at least a 3-fold change (increase or decrease) in expression, respectively. Marquee upregulated genes encoding developmental transcription factors are labelled. (E) Genome browser screenshots of representative developmental genes which, upon Rnf2 inhibition, lose Aebp2 binding and H3K27me3 marking, and become transcriptionally active.
Catalytic activity of polycomb repressive complex 1 (PRC1) is required for aebp2 binding, H3K27me3 establishment, and transcriptional repression of developmental genes.