
Figure 2
- ID
- ZDB-IMAGE-220131-586
- Publication
- Hickey et al., 2022 - Establishment of developmental gene silencing by ordered polycomb complex recruitment in early zebrafish embryos
- All Figures
- Figures for Hickey et al., 2022
|
Figure 2
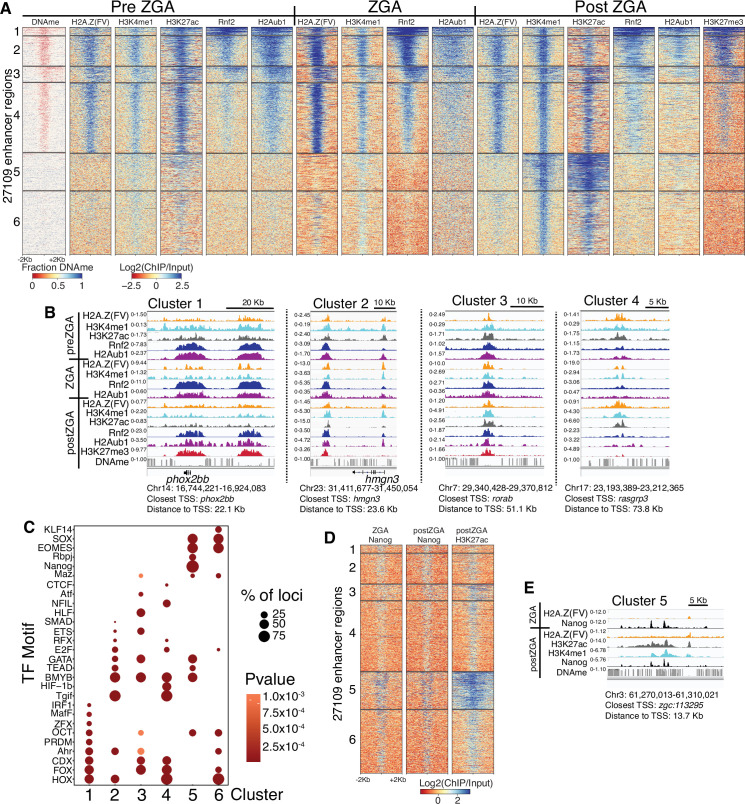
(A) K-means clustering of whole genome bisulfite sequencing (WGBS) (for DNAme) and chromatin immunoprecipitation (ChIP)-seq at enhancers (postzygotic genome activation [postZGA] H3K4me1 peak summits located outside of promoters). DNAme heatmap displays WGBS fraction-methylated scores (note: red color indicates regions that lack DNAme). ChIP-seq heatmaps display log2(ChIP/input) scores. (B) Genome browser screenshots of ChIP-seq enrichment at representative loci from the indicated K-means clusters in (A). (C) Transcription factor motif enrichment from HOMER (Heinz et al., 2010) at enhancer clusters from (A). (D) Features of an enhancer cluster with exceptionally high H3K27ac and Nanog binding. K-means clusters generated in (A) were utilized to plot heatmaps of Nanog and H3K27ac. (E) A genome browser screenshot depicting Nanog and H3K27ac ChIP enrichment at a DNA-methylated enhancer from cluster 5 in (D).
Polycomb repressive complex 1 (PRC1) occupancy and activity precedes H3K27me3 at enhancers.