
Figure 3
- ID
- ZDB-IMAGE-220131-588
- Publication
- Hickey et al., 2022 - Establishment of developmental gene silencing by ordered polycomb complex recruitment in early zebrafish embryos
- All Figures
- Figures for Hickey et al., 2022
|
Figure 3
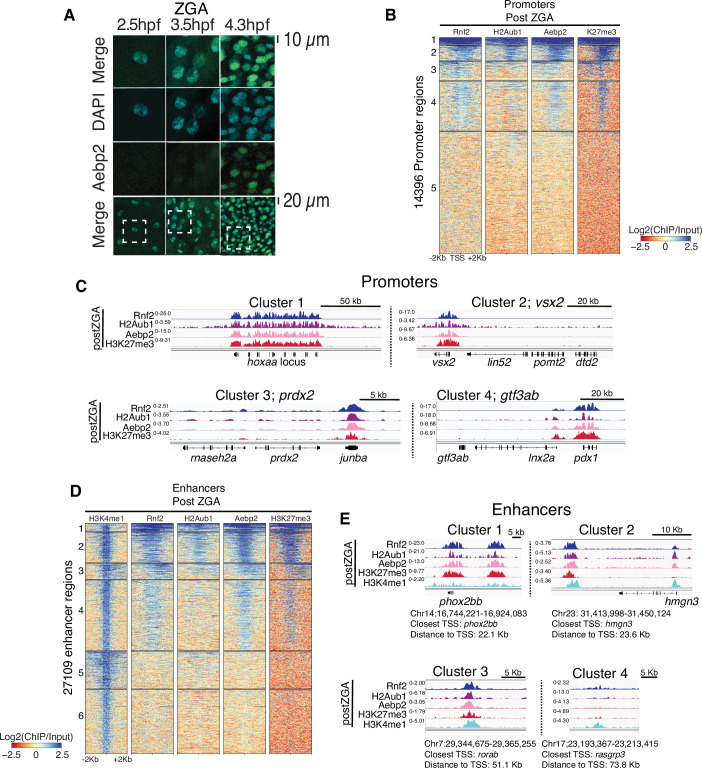
(A) Nuclear Aebp2 detection by immunofluorescence in postzygotic genome activation (postZGA) zebrafish embryos (4.3 hr post fertilization [hpf]). No Aebp2 staining was detected at preZGA (2.5 hpf) or ZGA (3.5 hpf). Bottom row: The dashed square indicates the field of view in upper panels. One of three biological replicates is shown. (B) Aebp2 binding at promoters during postZGA overlaps and scales with occupancy of Rnf2, H2Aub1, and H3K27me3. Promoter clusters from Figure 1C were utilized to plot heatmaps. (C) Genome browser screenshots of chromatin immunoprecipitation (ChIP)-seq at representative promoter loci from clusters in (B). (D) Aebp2 binding at enhancers during postZGA overlaps with occupancy of Rnf2, H2Aub1, and H3K27me3. Enhancer clusters from Figure 2A were utilized to plot heatmaps. (E) Genome browser screenshots of ChIP-seq enrichment at representative enhancer loci from clusters in (D).
Aebp2-polycomb repressive complex 2 (PRC2) mediates de novo H3K27me3 at loci pre-marked by H2Aub1.