
- Title
-
Enhanced anti-angiogenic activity of novel melatonin-like agents
- Authors
- Hwang, S.J., Jung, Y., Song, Y.S., Park, S., Park, Y., Lee, H.J.
- Source
- Full text @ J. Pineal Res.

Structure and IC50 of melatonin-like molecules. A, The molecular structures of melatonin (M) and its derivatives 1‒9. B, The effect of M and 1‒9 on cell viability in HCT116 human colon cancer cells. White bars indicate the cell viability when treated with compound at 1.0 mM. Values are expressed relative to vehicle-treated cells, normalized to 100% ± the standard deviation (SD), and were obtained from 3 independent experiments. *P <.05, **P <.01, and ***P <.001 in vehicle vs. compound treatment. The IC50 values of M and 1‒9 in HCT116 human colon cancer cells were 4.48, 6.25, 5.60, 0.81, 0.56, 0.56, 8.51, 3.67, 2.87, and 0.41 mM, respectively |

NB-5-MT (2) suppresses HIF-1-mediated transactivation and ROS generation through enhanced cellular uptake. (A-B) Under hypoxia, HCT116 cells were treated with 1 mM of melatonin (M), or its derivatives 1, 2, 6, and 7 for 4 hr The expression of HIF-1α and VEGF was analyzed by RT-PCR and western blot. A, The effect of M, 1, 2, 6, and 7 on HIF-1α mRNA and protein expression under hypoxic conditions. B, The effect of M, 2, and 7 on VEGF, Glut1, and EPO mRNA expression under hypoxic conditions. β-actin was used as a loading control. C, The effect of M, 2, and 7 on VEGF protein expression under hypoxic conditions. Tubulin was used as the loading control. Experiments were performed in triplicate, and representative images are shown. D, The effect of derivative 2 on HIF-1α-mediated transactivation. HCT116, HeLa, and MDA-MB-231 cells were transfected with pSV40promoter-EpoHRE-Luc and then treated with either 1 mM of M, or 2. Values are expressed relative to vehicle-treated cells, normalized to 100. Values shown are the means ± SD and were obtained from 3 independent experiments. *P <.05 in vehicle vs. hypoxia; +P <.05, hypoxia vs. hypoxia plus M or 2 treatment. E, The effect of 2 on oxidative stress in HCT116, HeLa, and MDA-MB-231 cells. Cells were treated with either 1 mM of M, or 2 under hypoxia. Intracellular ROS were stained with a fluorescent dye (CellROX Green Reagent). Cell nuclei were counterstained with Hoechst 33 362 (blue). Experiments were performed in triplicate and representative images are shown. F, Cellular uptake of 2 in HCT116, HeLa, and MDA-MB-231 cells. Values are the means ± SD and were obtained from 3 independent experiments. *P <.05 |

NB-5-MT (2) reduces HIF-1α stability through pVHL binding. A, The dose dependence of 2 on HIF-1α expression. Under hypoxia, HCT116, HeLa, and MDA-MB-231 cells were treated with various concentrations (0.125-1.0 mM) of 2 for 4 hr HIF-1α expression was examined by western blot analysis. B, The effect of 2 on the stability of endogenous HIF-1α. Under hypoxia, HCT116 cells were incubated with or without 1.0 mM of 2 in the presence of the proteasome inhibitor MG132 for 4 hr (C) The effect of 2 on the stability of exogenous HIF-1α and the expression of VEGF. Empty vector (EV) or HIF-1α expression plasmid was transiently transfected in HCT116 cells. After 24 h, HCT116 cells were incubated with or without 1.0 mM of 2 in the presence of the proteasome inhibitor MG132 for 4 hr (D) The effect of 2 on the binding between HIF-1α and pVHL. Under hypoxia, HCT116 cells were incubated with or without 1.0 mM of 2 in the presence of the proteasome inhibitor MG132 for 4 hr, and then 500 μg of total protein was immunoprecipitated with either anti-IgG or anti-VHL antibodies. Western blotting was performed with anti-HIF-1α and anti-pVHL antibodies |

NB-5-MT (2) suppresses hypoxia-mediated angiogenesis in vitro. (A-B) Under hypoxia, HCT116 cells were incubated with 1 mM of melatonin (M) or 2 for 16 hr Conditioned medium (CM) was collected from HCT116 cells or MDA-MB-231 cells and added to HUVECs for angiogenesis assays. (A) Inhibitory effect of 2 on angiogenesis in human umbilical vein endothelial cells (HUVECs) in vitro. Representative images of tube formation (top), invasion (middle), and migration (bottom) assays from 3 independent experiments. (B) Relative anti-angiogenic effect of 2 using the conditioned media of HCT116 cells. Graphs of in vitro tube formation (left), invasion (middle), and migration (right). (C) Relative anti-angiogenic effect of 2 using the conditioned media of MDA-MB-231 cells. Graphs of in vitro tube formation (left), invasion (middle), and migration (right). Data are the mean ± SD from 3 independent experiments. *P <.05 and **P <.01, vehicle vs. hypoxia; +P <.05 and ++P <.01, hypoxia vs. hypoxia plus compound treatment |

NB-5-MT (2) suppresses angiogenesis in vivo. (A-B) Inhibitory effect of 2 on retinal vascularization in DMOG-treated Tg(fli1a:EGFP) zebrafish larvae. A, Representative images of retinal vascularization. DMOG-mediated retinal vascularization was decreased by treatment with 1 mM of 2. Nuclei were stained with 1 μg/ml DAPI (PBS). Scale bar, 100 μm. B, Quantification of vessel diameters in zebrafish retinas. Data are expressed as the mean ± SD (n = 20). **P <.01, vehicle vs. DMGF; +P <.05 and ++P <.01, DMOG vs. DMOG plus compound. C, Inhibitory effect of 2 on VEGF and HIF-1α mRNA expression in DMOG-treated zebrafish larvae. D, Inhibitory effect of 2 on HIF-1α protein expression in zebrafish larvae. (E) Inhibitory effect of 2 in an in vivo Matrigel plug assay. Matrigel plugs were prepared with bFGF alone, bFGF plus melatonin, or bFGF plus 2, and implanted into C57/BL6 mice. The mice were euthanized 15 days after implantation, and the plugs were recovered. Representative images of macroscopic Matrigel plugs (top panels) from 3 independent experiments. Scale bar, 0.5 mm. Hemoglobin levels in the Matrigel plugs (bottom) were determined using Drabkin's solution. The hemoglobin content was normalized to the weight of the plug. Data are expressed as the mean ± SD (n = 6). *P <.05, vehicle vs. bFGF; +P <.05, bFGF vs. bFGF plus compound |
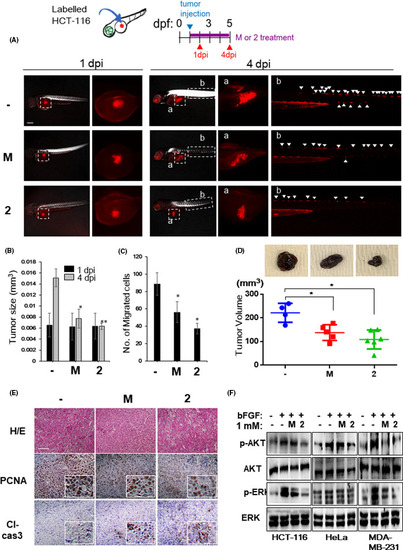
NB-5-MT (2) inhibits tumor growth and invasion in a zebrafish xenograft model in vivo. Human HCT116 cancer cells were injected into the abdominal perivitelline space of zebrafish larvae at 2 days postfertilization (dpf) and treated with vehicle, melatonin (M), or NB-5-MT (2). Photographs were taken at 1 and 4 dpi, and the xenograft size and the number of cancer cells that invaded into nearby tissues were quantified in 20 larvae/group. (A) Representative images from 20 fish/group at 1 and 4 dpi. Scale bar, 200 μm. Regions of interest (labeled a, b) are indicated on overview images of the xenografts in the yolk sac and migrated cancer cells in the trunk, respectively. White arrowheads indicate the migrated cancer cells. (B) The size of the tumor xenografts was analyzed quantitatively at 1 and 4 dpi. C, The average number of migrating cancer cells at 4 dpi. The data represent the mean ± SD (n = 3). *P <.05 and **P <.01, vehicle vs. compound treatment. (D) The effects of 2 on the tumor growth using mouse xenograft model of murine melanoma B16F10 cells. Top, the representative images of the tumor growth. (E) Proliferating cell nuclear antigen (PCNA) and cleaved caspase-3 (Cl-cas3) expressions were analyzed by immunohistochemical analysis in mouse xenograft tumors. Scale bar, 500 μm. (F) The effect of 2 on AKT and ERK signaling in HCT116, HeLa, and MDA-MB-231 cells. Representative western blot showing phosphorylated AKT (p-AKT), total AKT, phosphorylated ERK (p-ERK), and total ERK levels |