
|
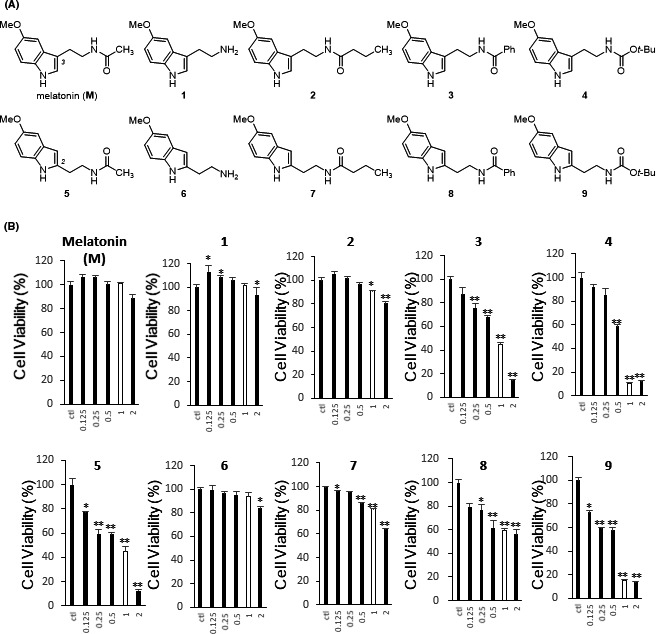
FIGURE 1 Structure and IC50 of melatonin-like molecules. A, The molecular structures of melatonin (M) and its derivatives 1‒9. B, The effect of M and 1‒9 on cell viability in HCT116 human colon cancer cells. White bars indicate the cell viability when treated with compound at 1.0 mM. Values are expressed relative to vehicle-treated cells, normalized to 100% ± the standard deviation (SD), and were obtained from 3 independent experiments. *P <.05, **P <.01, and ***P <.001 in vehicle vs. compound treatment. The IC50 values of M and 1‒9 in HCT116 human colon cancer cells were 4.48, 6.25, 5.60, 0.81, 0.56, 0.56, 8.51, 3.67, 2.87, and 0.41 mM, respectively