
|
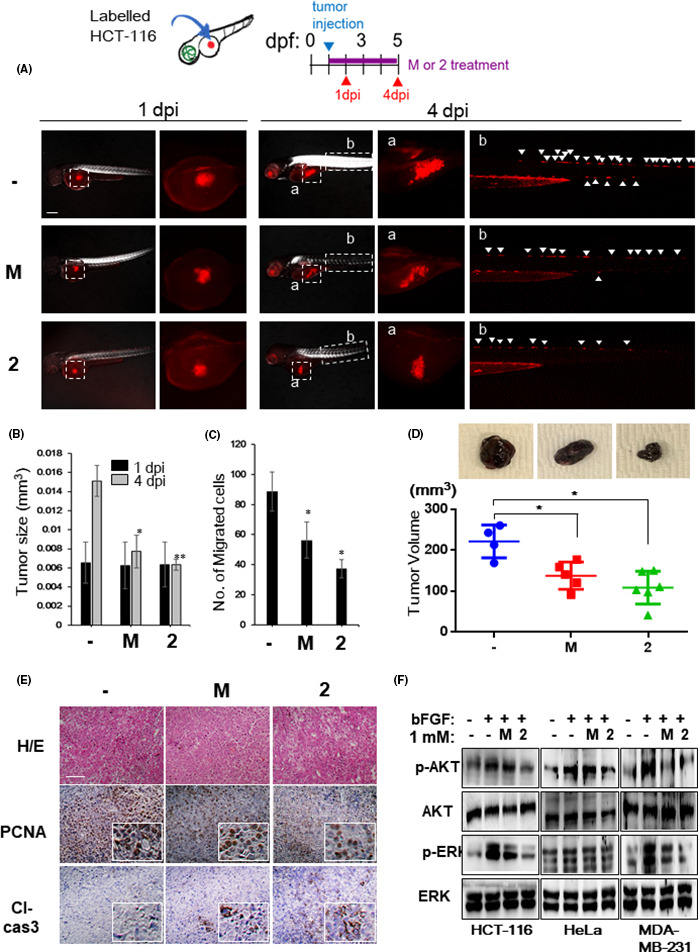
FIGURE 6 NB-5-MT (2) inhibits tumor growth and invasion in a zebrafish xenograft model in vivo. Human HCT116 cancer cells were injected into the abdominal perivitelline space of zebrafish larvae at 2 days postfertilization (dpf) and treated with vehicle, melatonin (M), or NB-5-MT (2). Photographs were taken at 1 and 4 dpi, and the xenograft size and the number of cancer cells that invaded into nearby tissues were quantified in 20 larvae/group. (A) Representative images from 20 fish/group at 1 and 4 dpi. Scale bar, 200 μm. Regions of interest (labeled a, b) are indicated on overview images of the xenografts in the yolk sac and migrated cancer cells in the trunk, respectively. White arrowheads indicate the migrated cancer cells. (B) The size of the tumor xenografts was analyzed quantitatively at 1 and 4 dpi. C, The average number of migrating cancer cells at 4 dpi. The data represent the mean ± SD (n = 3). *P <.05 and **P <.01, vehicle vs. compound treatment. (D) The effects of 2 on the tumor growth using mouse xenograft model of murine melanoma B16F10 cells. Top, the representative images of the tumor growth. (E) Proliferating cell nuclear antigen (PCNA) and cleaved caspase-3 (Cl-cas3) expressions were analyzed by immunohistochemical analysis in mouse xenograft tumors. Scale bar, 500 μm. (F) The effect of 2 on AKT and ERK signaling in HCT116, HeLa, and MDA-MB-231 cells. Representative western blot showing phosphorylated AKT (p-AKT), total AKT, phosphorylated ERK (p-ERK), and total ERK levels