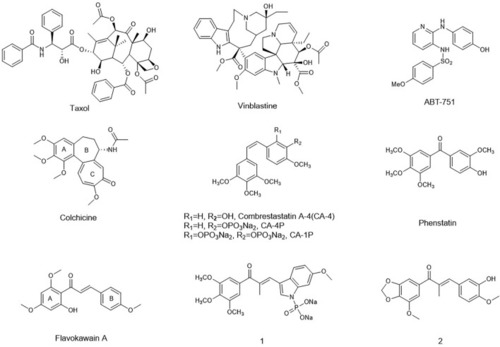
Representative tubulin inhibitors with anti- angiogenesis potency.

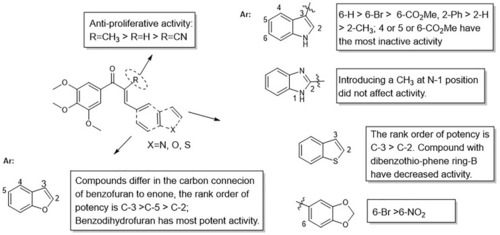
Summarized SARs of synthesized chalcone analogs.

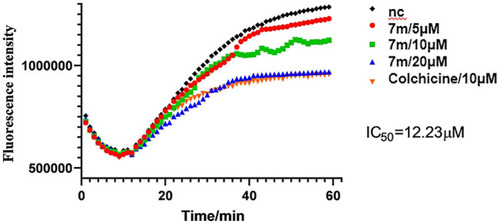
Tubulin polymerization inhibitory activity of 7m in vitro. Polymerization of tubulin at 37°C, in the presence of 1% DMSO, compound 7m (5, 10, and 20 µM), and colchicine (10 µM), was measured by monitoring the excitation at 335 nm and emission at 460 nm. Data are presented as the mean ± SD from three independent experiments. **p < 0.01 vs. the vehicle control.

(A) The 2D binding model and hydrogen-bond interactions. (B) A 3D binging model of 7m in different configurations.

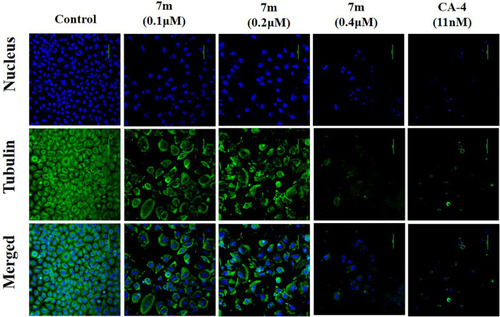
Immunofluorescence assay analysis of the effect of compound 7m on the cellular microtubule network after treatment with DMSO (control) or 7m at the indicated concentrations (0.1, 0.2, and 0.4 µM) for 24 h. Microtubules and unassembled tubulin are shown in green, and DNA is shown in blue.

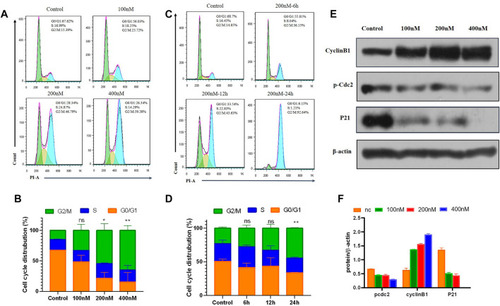
Compound 7m induced cell cycle arrest in G2/M arrest on MCF-7 cells. (A) Cells were treated with indicated concentrations of 7m for 24 h, and profiles were obtained by flow cytometry. (B) The percentage of cell cycle from (A) is illustrated in plots (C). Cells were treated with 200 nM 7m for 0, 6, 12, 24 h, respectively, and analyzed by flow cytometry. (D) The percentage of cell cycle from (C) is illustrated in plots. (E) MCF-7 cells were treated with 7m, then the cells were harvested, and the protein expressions of Cyclin B1, p-Cdc2, and P21 were detected by Western blotting assay. (F) Quantitative analysis of the expression of Cyclin B1, p-Cdc2, and P21 from experiments as in (E). Data are presented as mean ± SD of at least three independent experiments.

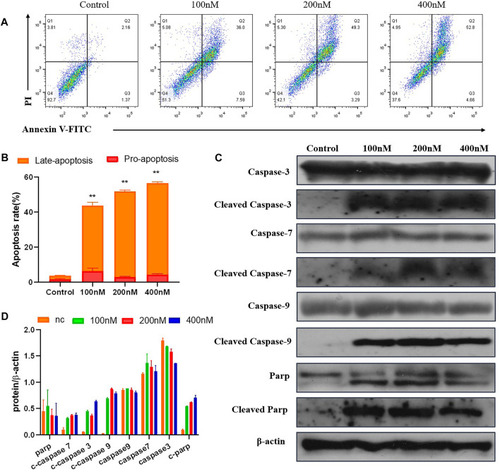
The compound 7m induces MCF-7 cell apoptosis. (A) Apoptosis ratio detection by Annexin/PI double staining assay through flow cytometry analysis treated with indicated concentrations of compound 7m for 48 h. (B) The quantitative analysis of apoptotic rate at early and advanced stages of MCF-cells. (C) Western blot analysis of the apoptosis-related proteins. (D) The quantitative analysis of the protein levels. The data are presented as the mean ± SD of three independent tests.

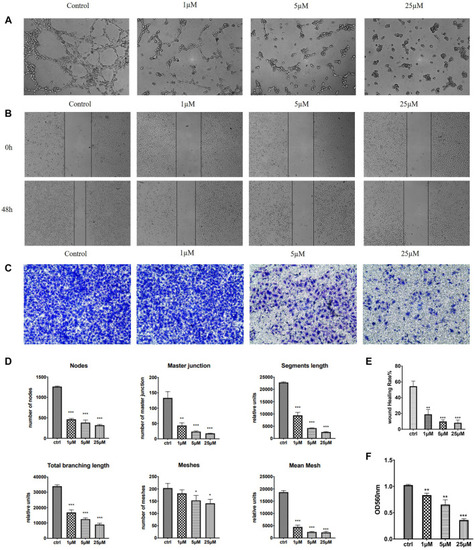
Effect of 7m on the human umbilical vein endothelial cells (HUVECs) migration, invasion, and tube formation. (A) Representative images depicting the vascular structure formation of HUVECs by treatments with 7m for 6–8 h. (B) Scratches were created and images were captured using phase-contrast microscopy at 0 and 48 h after treatments with 7m at different concentrations (1, 5, and 25 µM) or 1% DMSO. (C) The invasion suppressing effects of 7m against HUVECs by Transwell assay. (D) Quantitative evaluation of indicated concentrations of 7m on standard parameters of HUVEC tubule formation. Mean ± SEM of three experiments. **p < 0.01; ***p < 0.001 (E) Inhibitory rates of 7m on the HUVEC migration. (F) Quantitative analysis of the migration ability. *p < 0.05, **p < 0.01; ***p < 0.001, vs. control; = 3.

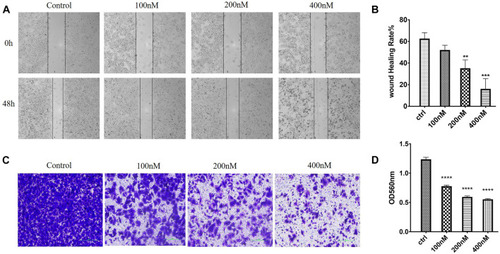
Effects of 7m on human breast adenocarcinoma (MCF-7) cell migration and invasion in vitro. (A) Images of MCF-7 cell migration inhibited by 7m determined in wound healing assay. (B) Inhibitory rates of 7m on MCF-7 cell migration. (C) Inhibition of cellular invasion by 7m in Transwell assay. (D) Quantitative analysis of the migration ability of MCF-7 cells after the treatment of 7m. The experiments were repeated three times, and results are indicated as means ± SD. *p < 0.05, **p < 0.01; ***p < 0.001 vs. untreated control.

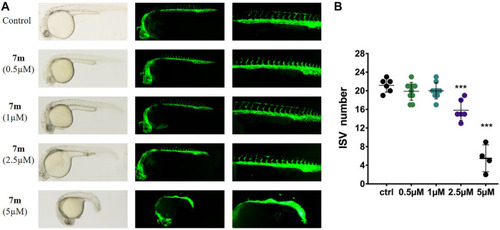
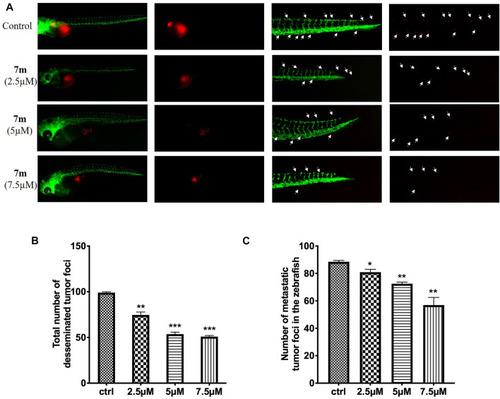
Anti-angiogenic effects of 7m in zebrafish embryos. (A) Zebrafish embryos were incubated with the tested compounds at 0.5, 1, 2.5, and 5 µM. The left angiogenic vessels were magnified and shown in the right section. (B) Histogram showed the numbers of zebrafish intersegmental vessels (ISVs) per field under confocal microscopy. Results represented the means ± SD. **p < 0.01; ***p < 0.001 compared with untreated control.

(A) Inhibitory effects of 7m on the proliferation and metastasis of MCF-7 cells in zebrafish xenograft models. CMTPX-labeled MCF-7 cells (red) were microinjected into zebrafish embryos, and indicated concentrations of 7m were added. (B) Quantification of the fluorescent area of the tumor xenografts, representing total MCF-7 cells in zebrafish. (C) Fluorescence intensity of the tumor xenografts in trunk.

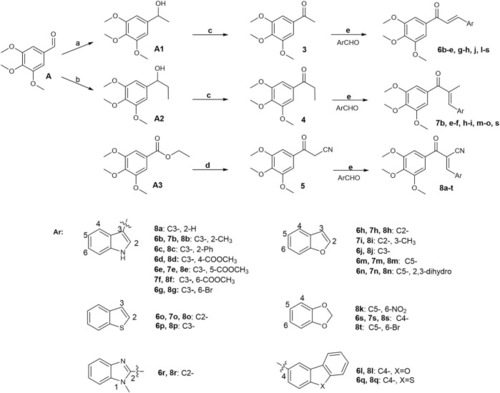
Reagents and conditions: (A) CH3MgBr, THF, 0°C–25°C; H2O, 81%. (B) CH3CH2MgBr, THF, 0°C–25°C; H2O, 50%. (C) PCC, CH2Cl2, 0°C–25°C; H2O, 74%. (D) CH3CN-THF (1:1), NaH, reflux, 81%. (E) MeOH or ethanol or THF or Dioxane, appropriate base, 0°C–75°C, 45%–95%.

Acknowledgments
This image is the copyrighted work of the attributed author or publisher, and ZFIN has permission only to display this image to its users. Additional permissions should be obtained from the applicable author or publisher of the image. Full text @ Front Chem