IMAGE

FIGURE 6

ID
ZDB-IMAGE-211216-196
Source
Figures for Sun et al., 2021
Image
Figure Caption

FIGURE 6

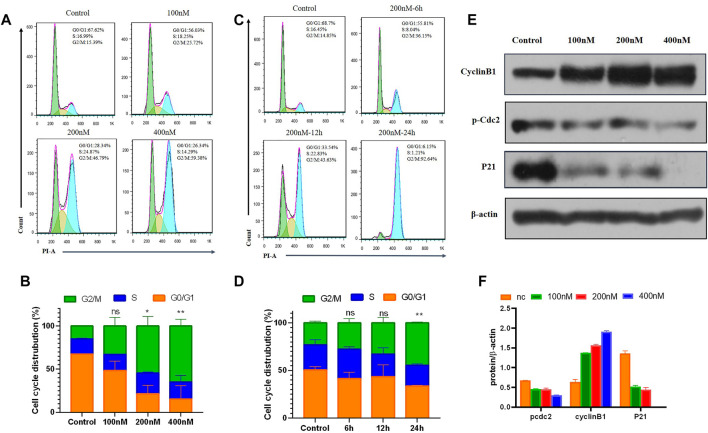
Compound 7m induced cell cycle arrest in G2/M arrest on MCF-7 cells. (A) Cells were treated with indicated concentrations of 7m for 24 h, and profiles were obtained by flow cytometry. (B) The percentage of cell cycle from (A) is illustrated in plots (C). Cells were treated with 200 nM 7m for 0, 6, 12, 24 h, respectively, and analyzed by flow cytometry. (D) The percentage of cell cycle from (C) is illustrated in plots. (E) MCF-7 cells were treated with 7m, then the cells were harvested, and the protein expressions of Cyclin B1, p-Cdc2, and P21 were detected by Western blotting assay. (F) Quantitative analysis of the expression of Cyclin B1, p-Cdc2, and P21 from experiments as in (E). Data are presented as mean ± SD of at least three independent experiments.

Acknowledgments
This image is the copyrighted work of the attributed author or publisher, and ZFIN has permission only to display this image to its users. Additional permissions should be obtained from the applicable author or publisher of the image. Full text @ Front Chem