
Image
|
Figure Caption
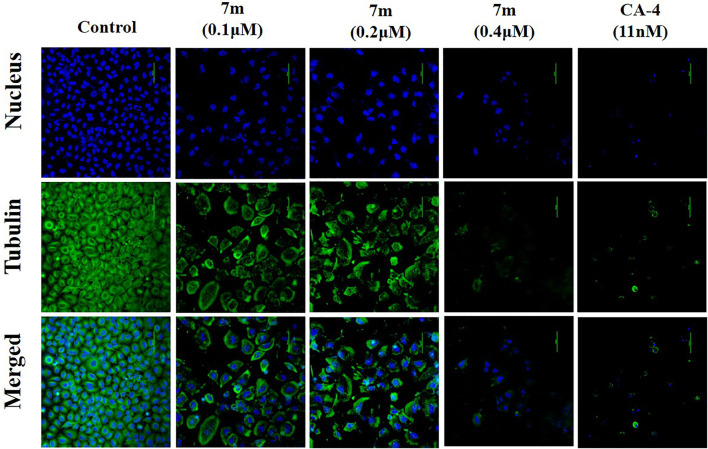
FIGURE 5
Immunofluorescence assay analysis of the effect of compound 7m on the cellular microtubule network after treatment with DMSO (control) or 7m at the indicated concentrations (0.1, 0.2, and 0.4 µM) for 24 h. Microtubules and unassembled tubulin are shown in green, and DNA is shown in blue.
Acknowledgments
This image is the copyrighted work of the attributed author or publisher, and
ZFIN has permission only to display this image to its users.
Additional permissions should be obtained from the applicable author or publisher of the image.
Full text @ Front Chem