
- Title
-
The FusX TALE Base Editor (FusXTBE) for Rapid Mitochondrial DNA Programming of Human Cells In Vitro and Zebrafish Disease Models In Vivo
- Authors
- Sabharwal, A., Kar, B., Restrepo-Castillo, S., Holmberg, S.R., Mathew, N.D., Kendall, B.L., Cotter, R.P., WareJoncas, Z., Seiler, C., Nakamaru-Ogiso, E., Clark, K.J., Ekker, S.C.
- Source
- Full text @ CRISPR J
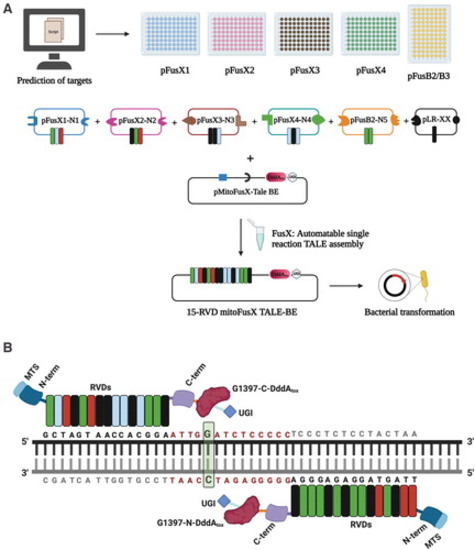
Schematic for the assembly of mitochondrial TALE base editors by the FusX reaction with the FusXTBE architecture. (A) FusX library of all combinations of RVD dimers and trimers enables the mitochondrial TALE base editor to be built in a single Golden Gate cloning step. (B) Schematic of FusXTBE binding to the human mitochondrial DNA target, ND4. Repeat divariable residues are shown in different colors (green-guanine-NN; blue-cytosine-HD; red-thymine-NG; black-adenine-NI). DNA binding region for each of the TALE monomers is black in color, and the spacer region is depicted in red. Genomic target C is highlighted in green with bold font. Figure 1 was created using Biorender.com. FusXTBE, FusX TALE Base Editor; MTS, mitochondrial targeting sequence; RVD, repeat variable di-residues; UGI, uracil glycosylase inhibitor. Color images are available online. |
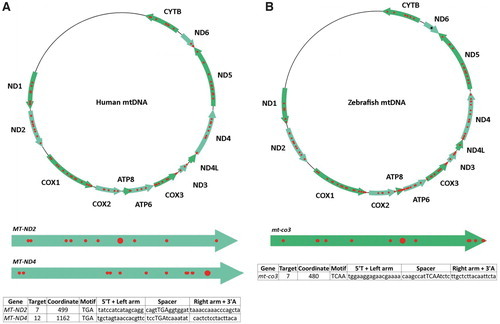
Targetable sites for PTC induction in human and zebrafish mtDNA. (A) Based on design parameters extrapolated from TALEN and initial mtDNA base editor work, and including assembly parameters for the FusX system, TALE Writer identified a total of 1617 potential target sites for C-to-T base editing in the human mitochondrial genome, 94 of which are amenable to PTC induction (red circles). The human mitochondrial genes MT-ND2 and MT-ND4 are represented below the human mtDNA map as light green arrows. The big red circles correspond to the targets chosen for this study. The table at the bottom includes the number of the targets within their respective genes, their local coordinates, their sequence motifs, and the sequences of their TALE arms and spacers. (B) Similarly, the zebrafish mitochondrial genome possesses a total of 1570 potential target sites for C-to-T base editing, 115 of which correspond to targets amenable to PTC induction (red circles). The zebrafish mitochondrial gene mt-co3 is represented below the zebrafish mtDNA map as a green arrow. The big red circle corresponds to the target chosen for this study. The table at the bottom includes the number of the target within mt-co3, its local coordinate, its sequence motif, and the sequences of its TALE arms and spacer. The single black asterisk in the zebrafish gene mt-nd6 represents a site for PTC induction made available by setting the maximum TALE arm and spacer lengths to 17 bp; such a FusXTBE format can be assembled via our FusX extender kit. mtDNA, mitochondrial DNA. PTC, premature termination codon. Color images are available online. |
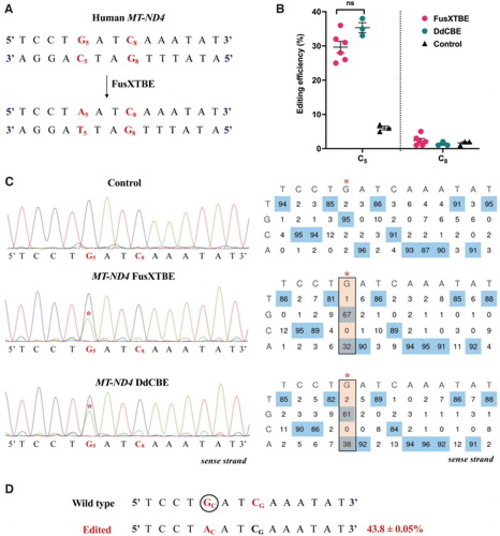
Demonstrating the editing activity of FusXTBE system in vitro for mtDNA. (A) Potential target sites favorable for base editing in the protospacer region of the targeted human MT-ND4 locus. (B) Editing efficiency of the mitochondrial FusXTBE and DdCBE systems in HEK293T cells for the C5 and C8 positions, assessed by Sanger sequencing. Data are represented from independent experiments. Red and green colored data points represent editing efficiency by FusXTBE and DdCBE systems, respectively. Black colored data points represent the wild-type heteroplasmy in the target locus in the nontransfected cells. Error bars are represented as standard error of the mean. No significant difference was observed in the editing efficiencies between the FusXTBE and DdCBE systems (p > 0.05 as determined by Student's t-test). (C) Representative chromatogram of the control (nontransfected) and cells transfected with FusXTBE and DdCBE plasmids. Asterisk (*) denotes the site of edit (C5 position) with corresponding editing percentage (C-to-T or G-to-A). Chromatograms and editing table plot were obtained using EditR. (D) Editing frequency of MT-ND4 alleles estimated by deep sequencing of the target amplicon. Edited cytosine (antisense strand) residue (or guanine on the sense strand) is highlighted in red and circled. Frequency reflects the mean percentage ± standard deviation from independent biological replicates (N = 6 for FusXTBE and N = 3 for DdCBE). A combination of left arm- pKTol2C-FusXTBE-C and right arm- pKTol2C-FusXTBE-N was used to obtain the edits. Color images are available online. |
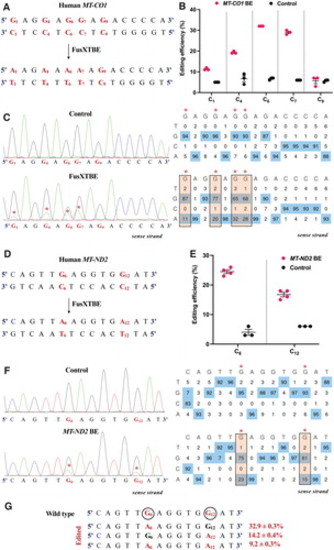
Engineering base edits in MT-CO1 and MT-ND2 genes in vitro using the FusXTBE system. (A) Sequence of the potential editing sites in the MT-CO1 protospacer region. (B) Editing efficiency for the 5′TCs present in the protospacer region plotted as individual data points for each of the target nucleotides in the transfected and control HEK293T cells. Error bars are represented as standard error of the mean. (C) Representative chromatogram of the control and cells transfected with MT-CO1 FusXTBE plasmid. Asterisk (*) denotes the site of edit with corresponding editing percentage (C-to-T or G-to-A). (D) Protospacer region in the MT-ND2 locus highlighting the edited nucleotides. (E) Editing efficiency assessed by Sanger sequencing of mitochondrial FusXTBE for the each of the 5′TCs (C6 and C12) in the MT-ND2 target locus. Error bars are represented as standard error of the mean. (F) Representative chromatogram of the control (nontransfected) and cells transfected with MT-ND2 FusXTBE plasmid DNA. Asterisk (*) denotes the sites of edit (C6 and C12 positions). (G) Editing frequency of MT-ND2 alleles obtained by deep sequencing. Edited cytosine (antisense strand) residue (or guanine on the sense strand) is highlighted in red and circled. Frequency reflects the mean percentage ± standard deviation from independent biological replicates [N = 3 for MT-CO1, N = 4 for MT-ND2 (C6), and N = 3 for MT-ND2 (C12)]. Each point represents data from independent experiments. Chromatograms and editing table plot were obtained using EditR. The combination of left arm- pKTol2C-FusXTBE-C and right arm- pKTol2C-FusXTBE-N was used to obtain the edits. Color images are available online. |
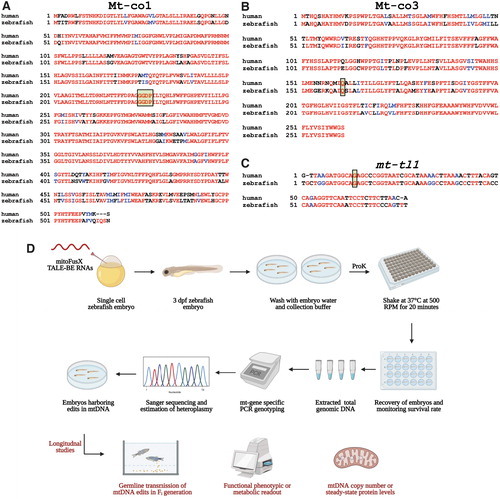
Schematic to prioritize base editing targets and noninvasively genotype mtDNA from zebrafish embryos. (A, B) Targets identified in the mitochondrial protein-coding genes, mt-co1 and mt-co3, were prioritized to test the editing efficiency of FusXTBE in vivo. Amino acid alignments are shown for the human MT-CO3 and MT-CO1 proteins with zebrafish Mt-co1 and Mt-co3 proteins. Edited amino acids are shaded and boxed. (C) The mitochondrial-encoded tRNA gene, mt-tl1, was prioritized to introduce base edits. Sequence alignment of human MT-TL1 and zebrafish ortholog mt-tl1 is shown. Target nucleotide is shaded and boxed. Red indicates sequences fully conserved between the two species. Blue indicates similar and black indicates positions with no similar or identical relationship. (D) Longitudinal study design assay for potential functional phenotype of the engineered edits in the zebrafish mtDNA locus. Zebrafish embryos are gently shaken in the genotyping buffer supplemented with proteinase K. Following recovery of the embryos, DNA is isolated from the shed cells, and mitochondrial genotyping is conducted for the target locus. Positive embryos can then be screened for germ line transmission or different functional and molecular studies. For Figure 4A–C, sequences were aligned using T-COFFEE multiple sequence alignment webserver and color-coded using BoxShade server. Figure 4D was created using Biorender.com. Color images are available online. |
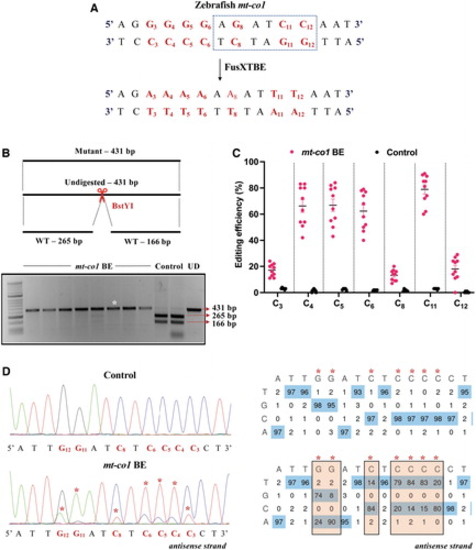
Introducing base edits in the zebrafish mt-co1 gene using the FusXTBE system. (A) Protospacer region in the mt-co1 locus highlighting the potential editing sites. Restriction site for the enzyme BstY1 is marked by dotted rectangle. (B) Screening of embryos harboring mutations by RFLP. C-to-T edits in the protospacer region leads to loss of recognition site for BstYI restriction enzyme. PCR amplicons from control embryos show the presence of two wild-type digested products. PCR amplicons from the injected embryos indicate the presence of an undigested band marked by white asterisk (*). Each lane represents an individual embryo. (C) Editing efficiency for the favorable 5′TC sites present in the protospacer region, both in mt-co1 BE RNA and control zebrafish embryos. Embryos harboring edits and control embryos are highlighted by red and black color circles, respectively. Each data point represents an individual zebrafish embryo. Data are represented from independent experiments (Injected: N = 120 embryos and were screened and N = 10 embryos [RFLP positive] were genotyped by Sanger sequencing; Control = 60 embryos were screened and N = 4 embryos were genotyped by Sanger sequencing for which data have been included in the graph). (D) Representative chromatogram of the control and mutant embryos. Asterisk (*) denotes the site of edit with corresponding editing percentage (C-to-T or G-to-A). Chromatograms and editing table plot were obtained using EditR. The combination of left arm- pT3-FusXTBE-N and right arm- pT3-FusXTBE-C was used to obtain the edits. RFLP, restriction fragment length polymorphism. Color images are available online. |
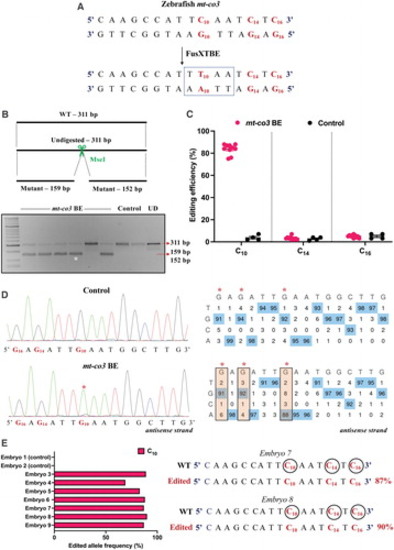
Engineering precise base edits in vivo in the zebrafish mt-co3 gene. (A) Sequence of the potential editing sites in the mt-co3 protospacer region. The resulting gain of the restriction site for the enzyme MseI postediting event is marked by a dotted rectangle. (B) Screening of embryos harboring mutations by RFLP. C-to-T edits in the protospacer region lead to gain of recognition site for the MseI restriction enzyme. PCR amplicons from the control embryos show the presence of uncut product (311 bp). PCR amplicons from the injected embryos indicate the presence of expected 159 and 152 bp digested bands marked by a white asterisk (*). Each lane represents an individual embryo. (C) Editing efficiency for the target C10 present in the protospacer region in both groups of zebrafish embryos. Red and black color circles denote mutant and control embryos, respectively. Each data point represents an individual zebrafish embryo. Data are represented from independent experiments (Injected: N = 140 embryos and were screened and N = 10 embryos [RFLP positive] were genotyped by Sanger sequencing; Control = 60 embryos were screened and N = 4 embryos were genotyped by Sanger sequencing for which data have been included in the graph). (D) Representative chromatogram of the control and injected embryos. Asterisk (*) denotes the site of edit with corresponding editing percentage (C-to-T or G-to-A). Chromatograms and editing table plot were obtained using EditR. The combination of left arm- pT3-FusXTBE-N and right arm- pT3-FusXTBE-C was used to obtain the edits. (E) Percentage of reads with C-to-T transitions estimated by deep sequencing of target amplicon. Representative data from embryo 8 show the editing frequency of cytosine residues (C10, C14, and C16) in the protospacer region (highlighted in red and circled). The combination of left arm- pT3-FusXTBE-N and right arm- pT3-FusXTBE-C was used to obtain the edits. Color images are available online. |
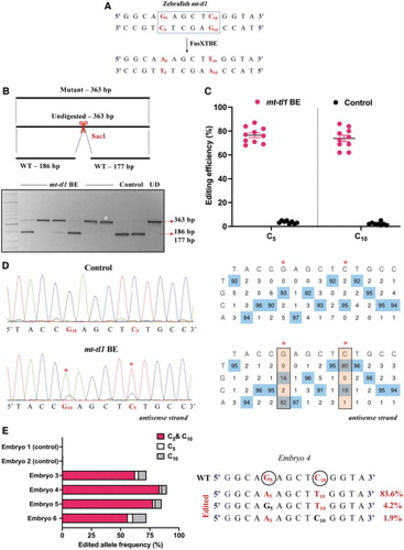
Modeling mutations in the zebrafish mt-tl1 gene. (A) Protospacer region highlighting the putative cytosine targets in the mt-tl1 locus. Restriction site for the enzyme SacI is marked by a dotted rectangle. (B) Screening of embryos harboring mutations by RFLP. C-to-T editing event in the target locus leads to loss of restriction site for the SacI restriction enzyme. The presence of undigested WT bands of expected size, 186 and 177 bp (marked by red arrow), is observed in control embryos. PCR amplicons from the injected embryos show the undigested band, indicated by the loss of restriction site postediting (marked by white asterisk*). Each lane represents an individual embryo. (C) Editing efficiency for the favorable 5′TC sites present in the protospacer region, both in mutant and control zebrafish embryos. Control embryos and embryos harboring desired C-to-T edits are highlighted by black and red color circles, respectively. Each data point represents an individual zebrafish embryo. Data are represented from independent experiments (Injected: N = 150 embryos and were screened and N = 10 embryos [RFLP positive] were genotyped by Sanger sequencing; Control = 60 embryos were screened and N = 7 embryos were genotyped by Sanger sequencing for which data have been included in the graph). (D) Representative chromatogram of the control and mutant embryos indicating the percentage of editing at each cytosine residue in the protospacer region. Asterisk (*) denotes the site of edit with corresponding editing percentage (C-to-T or G-to-A). Chromatograms and editing table plot were obtained using EditR. (E) Percentage of edited alleles with C-to-T edits at different cytosine residues obtained from deep sequencing. Representative data from embryo 4 show the editing frequency of cytosine (antisense strand) residue (or guanine on the sense strand), which is highlighted in red and circled. The combination of left arm- pT3-FusXTBE-N and right arm- pT3-FusXTBE-C was used to obtain the edits. Color images are available online. |
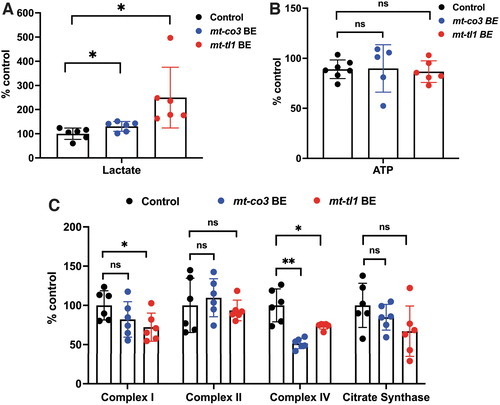
Functional consequence of base edits in mtDNA in zebrafish larvae. (A-B) Zebrafish larvae injected with mt-co3 and mt-tl1 BE RNAs raised to 7 dpf were collected and homogenized in 0.5 M perchloric acid and used for lactate (A) and ATP (B) assays. (A) Lactate concentrations in the samples were quantified (20 larvae each replicate: N = 6). Larvae injected with mt-co3 and mt-tl1 RNA displayed significant elevated lactate levels compared with the control (p < 0.05). Each data represent one biological replicate and error bars are represented as standard deviation. (B) No significant difference was observed in the steady-state ATP levels of larvae injected with the BE RNAs for mt-co3 and mt-tl1 genes compared with control larvae (p > 0.05) (N = 5 for mt-co3 and N = 6 for mt-tl1). ATP levels were maintained for both the groups. (C) For the mitochondrial respiratory chain complex activities, 20 larvae each tube were homogenized in the mitochondrial isolation buffer (250 mM sucrose, 20 mM Tris-HCl, 3 mM EDTA, pH 7.4) followed by differential centrifugation (to enrich mitochondrial fraction), and an assay was performed (N = 6 biological replicates of 20 pooled 7 dpf zebrafish larvae). Slight decrease in the complex I enzyme activity was observed for both mt-co3 and mt-tl1 BE groups compared with the control larvae, whereas activity for the complex II was maintained across all the three groups. For complex IV, a significant decrease in the activity was observed for both sets of larvae injected with mt-co3 and mt-tl1 BE RNA compared with the control. No difference in the citrate synthase activity was observed between the injected and control larvae (*p < 0.05; **p < 0.01). p-Values were determined by Student's t-test. Error bars represent the standard deviation. dpf, days postfertilization. Color images are available online. |