
|
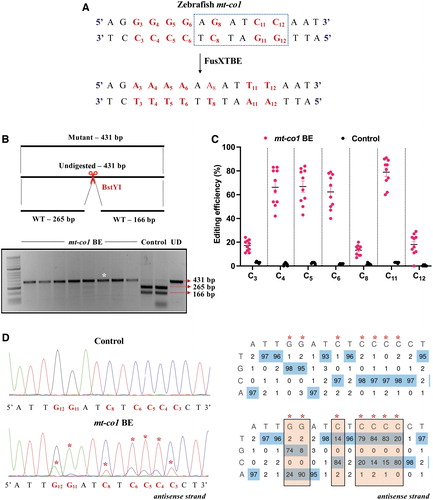
Fig. 6 Introducing base edits in the zebrafish mt-co1 gene using the FusXTBE system. (A) Protospacer region in the mt-co1 locus highlighting the potential editing sites. Restriction site for the enzyme BstY1 is marked by dotted rectangle. (B) Screening of embryos harboring mutations by RFLP. C-to-T edits in the protospacer region leads to loss of recognition site for BstYI restriction enzyme. PCR amplicons from control embryos show the presence of two wild-type digested products. PCR amplicons from the injected embryos indicate the presence of an undigested band marked by white asterisk (*). Each lane represents an individual embryo. (C) Editing efficiency for the favorable 5′TC sites present in the protospacer region, both in mt-co1 BE RNA and control zebrafish embryos. Embryos harboring edits and control embryos are highlighted by red and black color circles, respectively. Each data point represents an individual zebrafish embryo. Data are represented from independent experiments (Injected: N = 120 embryos and were screened and N = 10 embryos [RFLP positive] were genotyped by Sanger sequencing; Control = 60 embryos were screened and N = 4 embryos were genotyped by Sanger sequencing for which data have been included in the graph). (D) Representative chromatogram of the control and mutant embryos. Asterisk (*) denotes the site of edit with corresponding editing percentage (C-to-T or G-to-A). Chromatograms and editing table plot were obtained using EditR. The combination of left arm- pT3-FusXTBE-N and right arm- pT3-FusXTBE-C was used to obtain the edits. RFLP, restriction fragment length polymorphism. Color images are available online.