
- Title
-
The Anti-Tumoral Potential of Phosphonate Analog of Sulforaphane in Zebrafish Xenograft Model
- Authors
- Rudzinska-Radecka, M., Janczewski, Ł., Gajda, A., Godlewska, M., Chmielewska-Krzesinska, M., Wasowicz, K., Podlasz, P.
- Source
- Full text @ Cells
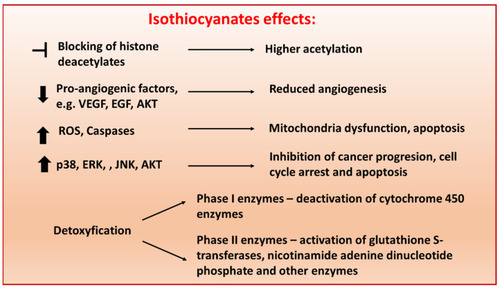
Schematic representation of molecular pathways targeted by isothiocyanates (ITCs) in cancer cells. ITCs exert their anti-tumor activities through various mechanisms, including (i) regulation of the epigenetic machinery, (ii) prevention of metastasis and angiogenesis, (iii) apoptosis via reactive oxygen species-initiated mitochondrial dysfunction (iv) inhibition of cell growth by causing cell cycle arrest and inducing cell death and (v) modulation of phase I and II enzymes [4]. The concentration in which ITCs present biological activity depends on chemical modifications and cell types. |

Microwave-assisted synthesis of LJ-NCS-1, LJ-NCS-4, and LJ-NCS-5. |

Microwave-assisted synthesis of LJ-NCS-3 using DMT/NMM/TsO−. |
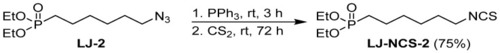
Synthesis of LJ-NCS-2 in Staudinger/aza–Wittig reaction. |
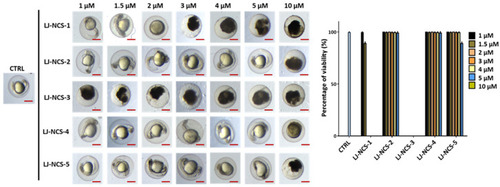
The effects of 24 h isothiocyanates treatment on morphology and mortality of 6 hpf zebrafish embryos at the experiment starting point. Representative images of embryos exposed to 1–10 µM of LJ-NCS-1–5 (n = 3 replicates, 50 embryos per replicate); bar scale = 450 µm. Percentage of viability-data are represented as mean ± SD. |
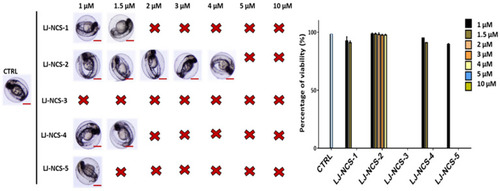
The effects of 48 h isothiocyanates treatment on morphology and mortality of 6 hpf zebrafish embryos at the experiment starting point. Representative images of embryos exposed to 1–10 µM of LJ-NCS-1–5 (n = 3 replicates, 50 embryos per replicate); bar scale = 450 µm Percentage of viability-data are represented as mean ± SD. |
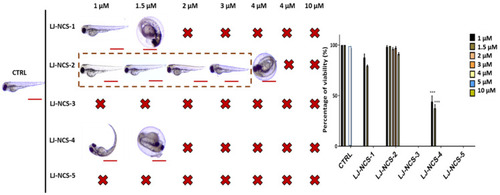
The effects of 72 h isothiocyanates treatment on morphology and mortality of 6 hpf zebrafish embryos at the experiment starting point. Representative images of embryos exposed to 1–10 µM of LJ-NCS-1–5 (n = 3 replicates, 50 embryos per replicate); bar scale = 950 µm. Percentage of viability-data are represented as mean ± SD; *** p < 0.001. |

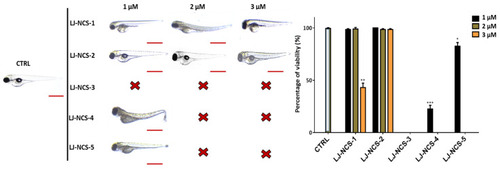
The effects of 24 h isothiocyanates treatment on morphology and mortality of 48 hpf zebrafish embryos at the experiment starting point. Representative images of embryos exposed to 1–3, of LJ-NCS-1–5 (n = 3 replicates, 50 embryos per replicate); bar scale = 950 µm. Percentage of viability-data are represented as mean ± SD; ** p < 0.01 and *** p < 0.001, **** p < 0.0001. |
The effects of 48 h isothiocyanates treatment on morphology and mortality of 48 hpf zebrafish embryos at the experiment starting point. Representative images of embryos exposed to 1–3, of LJ-NCS-1–5 (n = 3 replicates, 50 embryos per replicate); bar scale = 950 µm. Percentage of viability-data are represented as mean ± SD; * p < 0.05, ** p < 0.01 and *** p < 0.001. |
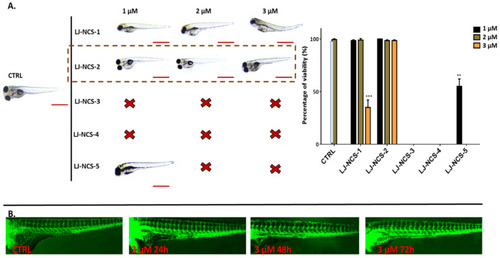
The effects of 72 h isothiocyanates treatment on morphology and mortality of 48 hpf zebrafish embryos at the experiment starting point. LJ-LNC-2 no effect on vascularization of zebrafish embryos. (A) Representative images of embryos exposed by 1–3, of LJ-NCS-1–5 (n = 3 replicates, 50 embryos per replicate); bar scale = 950 µm. Percentage of viability-data are represented as mean ± SD; ** p < 0.01, *** p < 0.001. (B) Representative picture (taken under fluorescence microscope) of blood vessels (green) of Tg(fli1:EGFP)y1 strain (48 hpf zebrafish embryos at the starting point) upon 3 µM LJ-NCS-2 treatment in 24, 48 and 72 h time points. |
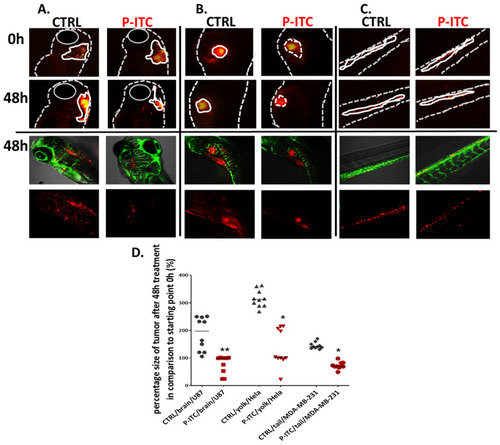
Phosphonate analog of sulforaphane (P-ITC) treatment inhibits tumor growth and fluorescence emitted from human glioma, cervical, and breast cancer cells grown in zebrafish embryos. The U87, HeLa and MDA-MB-231 cells were labeled with DiL (red fluorescence dye) and injected into the (A). hindbrain ventricle (U87), (B). yolk sac region (HeLa) and (C). in the caudal hematopoietic tissue (MDA-MB-231) of 48 h post-fertilization zebrafish embryos. After 24 h human cancer cell-positive embryos were selected and treated with 3 µM of P-ITC for 48 h. The images were taken under a fluorescence microscope and analyzed under a confocal microscope at the end of the experiment (lower panel of pictures; red–human fluorescence cells, green–blood vessels). The fluorescence emitted by the red tumor masses of each treatment group (n = 10) was measured by ImageJ and calculated in percentage. (D) The mass tumor growing of control and upon P-ITC treatment were measured at the beginning of the experiment (0 h; 24 h after human cells injection) and after 48 h of treatment (48 h). The presented percentage is the average tumor size after 48 h compared to starting 0 h point. Percentage of data are represented as mean ± SD; * p < 0.05 and ** p < 0.01. |