
- Title
-
The Proapoptotic Gene Bad Regulates Brain Development via p53-Mediated Stress Signals in Zebrafish
- Authors
- Hung, J.C., Wu, J.L., Li, H.C., Chiu, H.W., Hong, J.R.
- Source
- Full text @ Cells
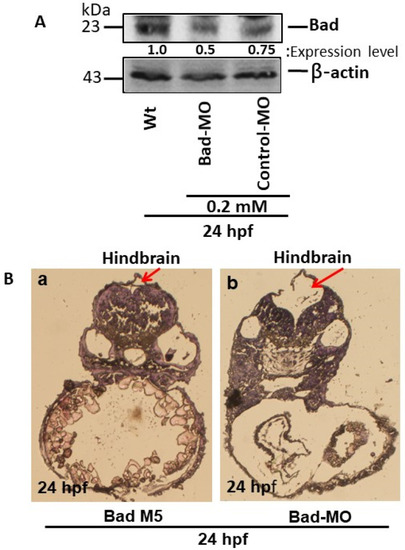
The BH3-only proapoptotic gene Bad can regulate brain development at 24 hpf. (A) Bad knockdown (lane 2 for 0.2 mM) shown by Western blot analysis and compared to the uninjected group (lane 1) and the normal control Bad-M5 group (lane 3). The protein expression levels were quantified by a Personal Densitometer (Molecular Dynamics). (B) Dissection and observation of brain development in loss-of-Bad-mediated PCD embryos at 24 hpf. HE staining showing hindbrain development in the Bad-M5 group in panel (Ba) and the Bad-Mo group in panel (Bb) at 24 hpf, as indicated by red arrows. |
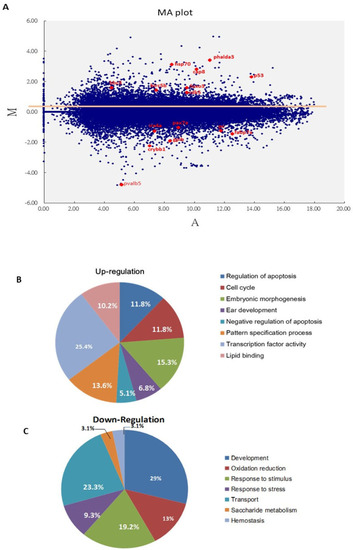
Screening of major cell death pathways via a DNA array approach with Bad knockdown at 24 hpf. (A) MA plot showing the distribution of upregulated and downregulated genes in the Bad MO group, with a cut-off of 2 fold changes compared to the Bad M5 group. The key factors p53 and caspase-8 are upregulated. The brain development genes crybb1, pva1b5, irx4a, pax7a, and fabp7a are marked in red. (B,C) Changes in biological function genes during loss-of-Bad-mediated PCD are analyzed in separate pie charts for upregulation (B) and downregulation (C). |
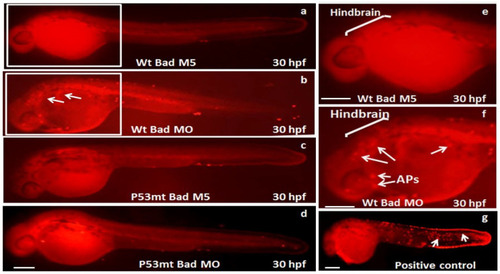
Identification of p53-mediated stress signaling can regulate apoptotic cell death during Bad knockdown in p53 mutant (p53M214K) zebrafish lines. Identification of TUNEL-positive cell death patterns in different fish lines at the 30 hpf stage. In the different fish lines (a–f), the TUNEL-positive cell deaths (APs), especially in the hindbrain area, are indicated by arrows. The positive control treated with hydrogen peroxide is shown in panel (g). Scale bar = 200 μm. |
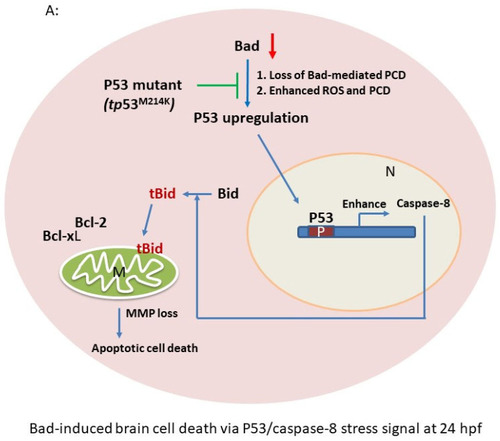
p53/caspase-8 death signaling involvement in Bad knockdown embryos at 24 hpf. (A) A network signaling death pathway was proposed based on accumulated data. The p53/caspase-8/tBid-mediated death pathway was induced. It also required upstream signaling from loss of Bad, leading to enhanced environmental stress with increased ROS and enhanced apoptotic cell death via the stress/death gene p53 and its correlated downstream gene expression caspase-8 or activation of tBid by cleavage from Bid. (B) Clear upregulation of p53 and caspase-8 demonstrated via qRT-PCR. All data were analyzed using either paired or unpaired Student’s t-tests, as appropriate. * p < 0.01. (C) Identification of apoptotic-related protein expression of p53/caspase-8/tBid as key molecules by Western blotting analysis at 24 hpf. Both p53 and caspase-8 showed stronger expression compared to the control group, correlated with downstream Bid cleavage and anti-apoptotic number Bcl-2 and Bcl-xL expression levels. (D) qRT-PCR evaluation of apoptosis-related gene expression with Bad knockdown in p53 mutant lines at 24 hpf. (E) Western blot analysis of apoptosis-related protein expression with Bad knockdown in p53 mutant fish lines correlated with downstream protein Bid cleavage and anti-apoptotic number Bcl-2 and Bcl-xL expression levels. |

p53/caspase-8 death signaling involvement in Bad knockdown embryos at 24 hpf. (A) A network signaling death pathway was proposed based on accumulated data. The p53/caspase-8/tBid-mediated death pathway was induced. It also required upstream signaling from loss of Bad, leading to enhanced environmental stress with increased ROS and enhanced apoptotic cell death via the stress/death gene p53 and its correlated downstream gene expression caspase-8 or activation of tBid by cleavage from Bid. (B) Clear upregulation of p53 and caspase-8 demonstrated via qRT-PCR. All data were analyzed using either paired or unpaired Student’s t-tests, as appropriate. * p < 0.01. (C) Identification of apoptotic-related protein expression of p53/caspase-8/tBid as key molecules by Western blotting analysis at 24 hpf. Both p53 and caspase-8 showed stronger expression compared to the control group, correlated with downstream Bid cleavage and anti-apoptotic number Bcl-2 and Bcl-xL expression levels. (D) qRT-PCR evaluation of apoptosis-related gene expression with Bad knockdown in p53 mutant lines at 24 hpf. (E) Western blot analysis of apoptosis-related protein expression with Bad knockdown in p53 mutant fish lines correlated with downstream protein Bid cleavage and anti-apoptotic number Bcl-2 and Bcl-xL expression levels. |
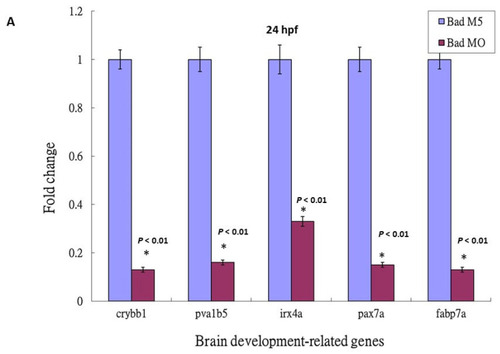
The identification of brain development-related genes was downregulated, but suppressed in the p53 mutant lines with Bad knockdown. (A) Identification of downstream brain development-related genes such as crybb1, pvalb5, irx4a, pax7a, and fabp7a in wild-type zebrafish by qRT-PCR at 24 hpf. All data were analyzed using either paired or unpaired Student’s t-tests, as appropriate. * p < 0.01. (B) Enhanced brain-development genes crybb1, pvalb5, irx4a, pax7a, and fabp7a in p53 mutant lines during Bad knockdown at 24 hpf, as shown by qRT-PCR. All data were analyzed using either paired or unpaired Student’s t-tests, as appropriate. * p < 0.01. |

The identification of brain development-related genes was downregulated, but suppressed in the p53 mutant lines with Bad knockdown. (A) Identification of downstream brain development-related genes such as crybb1, pvalb5, irx4a, pax7a, and fabp7a in wild-type zebrafish by qRT-PCR at 24 hpf. All data were analyzed using either paired or unpaired Student’s t-tests, as appropriate. * p < 0.01. (B) Enhanced brain-development genes crybb1, pvalb5, irx4a, pax7a, and fabp7a in p53 mutant lines during Bad knockdown at 24 hpf, as shown by qRT-PCR. All data were analyzed using either paired or unpaired Student’s t-tests, as appropriate. * p < 0.01. |
Brain development was directly restored during blockage of the p53-mediated stress signaling transition in p53 mutant lines with |

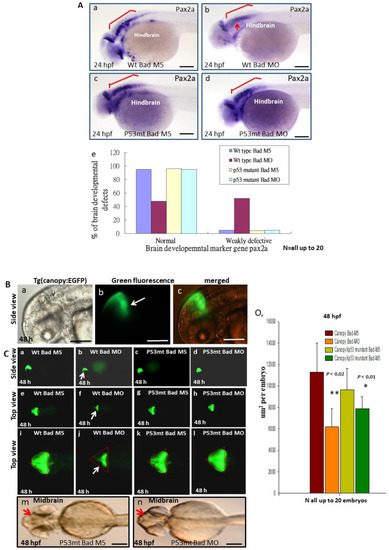
Brain development was directly restored during blockage of the p53-mediated stress signaling transition in p53 mutant lines with Bad knockdown. (A) Brain developmental marker pax2a expression in an in situ hybridization assay showing normal expression in the p53 mutant line (panels c and d) compared to the wild-type group (panels Aa–Ae) during Bad knockdown at 24 hpf. Defective marker expression was counted and is shown in panel (Ae). Scale bar = 100 μm. (B,C) The canopy-fused EGFP line was used to monitor brain development directly in the p53 mutant line during loss-of-Bad expression at 48 hpf. The midbrain/hindbrain boundary is indicated by an arrow. (C) Blockage of the p53-mediated stress signaling transition can restore brain development (indicated by arrows) compared to the wild-type (panels (Ca,Ce,Ci) for the Bad-M5 group; panels: (Cb,Cf,Cj) for the Bad-MO group) and p53 mutant lines (panels (Cc,Cg,Ck,Cm) for the Bad-M5 group; panels (Cd,Ch,Cl,Cn) for the Bad-MO group) at 48 hpf during Bad knockdown. Green fluorescence intensity was recorded and is shown in (Co). Scale bar = 200 μm. (D) Brain development was probed by used the marker gene fabp7a via in situ hybridization in the wild-type and p53 mutant lines. Changes in fabp7a marker gene expression at different angles were counted and are shown in (Df). Scale bar = 100 μm. All N = 7. All data were analyzed using either paired or unpaired Student’s t-tests, as appropriate. * p < 0.01; ** p < 0.02. |

Identification of brain functions through monitoring of swimming behavior at 72 hpf. Swimming speed over a limited length was monitored for different fish lines with and without Bad knockdown. The wild-type with Bad-MO group was slower than the other groups by approximately 5 s at 72 hpf. All data were analyzed using either paired or unpaired Student’s t-tests, as appropriate. * p < 0.01; ** p < 0.02; *** p < 0.05. |

Diagram of Bad’s involvement in committed PCD and brain development from 0.5 to 72 hpf. Early (5.4–12 hpf) PCD is essential for smooth early cell migration and for the formation of the 3 germ layers in later development, which is connected to late (after 12 hpf) PCD for tissue and organ development. Bad-mediated cell death is required for reducing environmental stress, which is correlated with triggering p53-mediated stress signaling on the p53/caspase-8/tBid death pathway and suppression of brain development genes such as irx4a, pax7a, and fabp7a, which are correlated with action behavior. Furthermore, Bad-mediated brain defects should be rescued in the tumor-suppressor p53 mutant (p53M214K) line. This model system may be a better system for human brain diseases such as autism, psychoses, cognitive disorders, and XLID in that they are correlated with Bad defects. |