
|
Figure 6
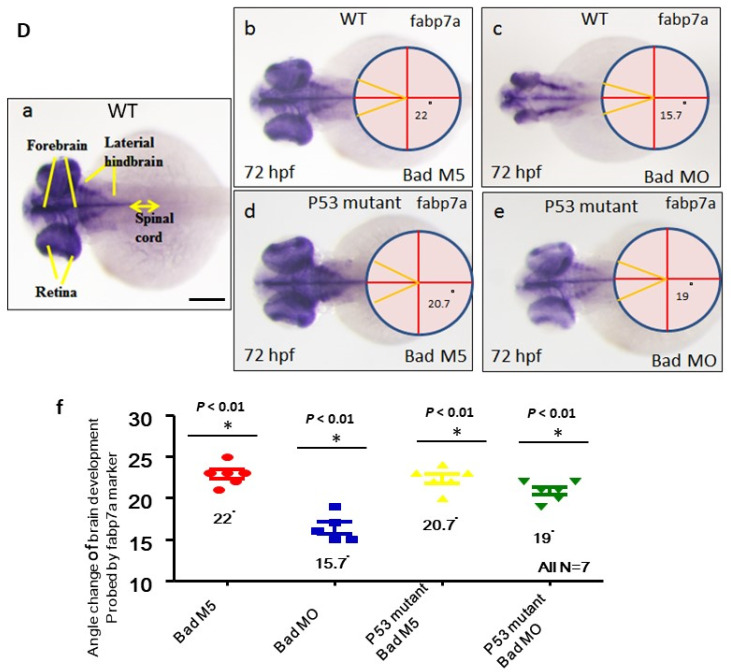
Brain development was directly restored during blockage of the p53-mediated stress signaling transition in p53 mutant lines with Bad knockdown. (A) Brain developmental marker pax2a expression in an in situ hybridization assay showing normal expression in the p53 mutant line (panels c and d) compared to the wild-type group (panels Aa–Ae) during Bad knockdown at 24 hpf. Defective marker expression was counted and is shown in panel (Ae). Scale bar = 100 μm. (B,C) The canopy-fused EGFP line was used to monitor brain development directly in the p53 mutant line during loss-of-Bad expression at 48 hpf. The midbrain/hindbrain boundary is indicated by an arrow. (C) Blockage of the p53-mediated stress signaling transition can restore brain development (indicated by arrows) compared to the wild-type (panels (Ca,Ce,Ci) for the Bad-M5 group; panels: (Cb,Cf,Cj) for the Bad-MO group) and p53 mutant lines (panels (Cc,Cg,Ck,Cm) for the Bad-M5 group; panels (Cd,Ch,Cl,Cn) for the Bad-MO group) at 48 hpf during Bad knockdown. Green fluorescence intensity was recorded and is shown in (Co). Scale bar = 200 μm. (D) Brain development was probed by used the marker gene fabp7a via in situ hybridization in the wild-type and p53 mutant lines. Changes in fabp7a marker gene expression at different angles were counted and are shown in (Df). Scale bar = 100 μm. All N = 7. All data were analyzed using either paired or unpaired Student’s t-tests, as appropriate. * p < 0.01; ** p < 0.02.