
- Title
-
Decline in Constitutive Proliferative Activity in the Zebrafish Retina with Ageing
- Authors
- Hernández-Núñez, I., Quelle-Regaldie, A., Sánchez, L., Adrio, F., Candal, E., Barreiro-Iglesias, A.
- Source
- Full text @ Int. J. Mol. Sci.
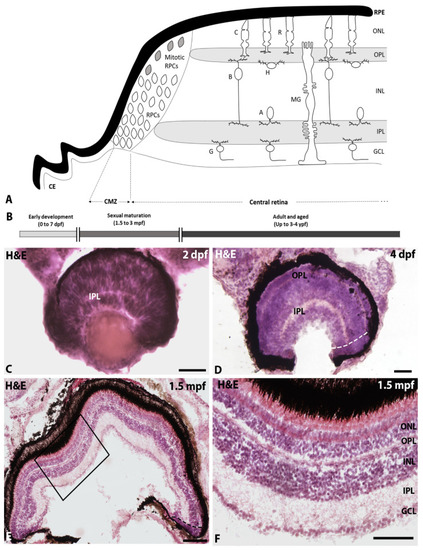
(A) Schematic drawing of the mature zebrafish retina showing the ciliary epithelium of the ciliary body (CE), the retinal pigment epithelium (RPE) and the neural retina with two differentiated regions: the CMZ, which contains different types of retinal progenitor cells (RPCs), and the central retina with a layered structure, which contains the outer (OPL) and inner (IPL) plexiform layers and three cell layers [ONL with the nuclei of cone (C) and rod (R) photoreceptors; inner nuclear layer (INL) with the nuclei of bipolar (B), amacrine (A), horizontal (H) and Müller glia (MG) cells; and a GCL with the nuclei of ganglion cells (G)]. (B). Timeline of the zebrafish life stages and ages analysed in this study. (C–F). Hemaetoxylin-eosin-stained transverse sections of the retina of 2 dpf (C), 4 dpf (D) and 1.5 mpf (E,F) zebrafish showing the maturation of retinal organization. Dashed lines in (D) and (E) indicate the limit between the CMZ and the central retina. (F) Detail of the central retina squared in (E). Scale bars: (C,D): 50 µm; (E): 200 µm; (F): 100 µm. |
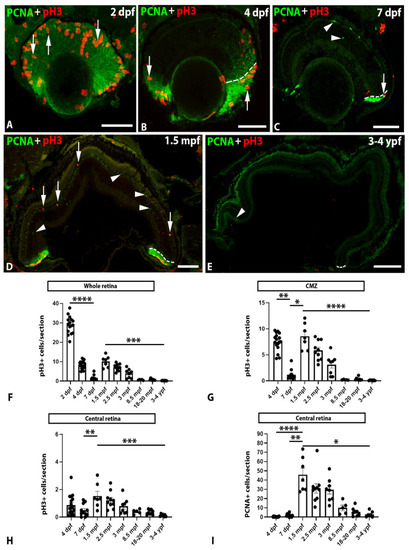
(A–E). Transverse sections of the retina of 2 dpf (A), 4 dpf (B), 7 dpf (C), 1.5 mpf (D), and 3–4 ypf (E) zebrafish specimens showing the presence of PCNA (arrowheads) or pH3 (arrows) positive cells. In 2 dpf to 1.5 mpf zebrafish (A–D), PCNA or pH3 expressing cells were mainly located in the CMZ but also in the central retina, while, in 3–4 ypf, specimens (E) pH3+ and PCNA+ cells almost disappeared. Dashed lines in (B–E) indicate the limit between the CMZ and the central retina. Scale bars: (A–C): 50 µm; (D): 100 µm; (E): 200 µm. (F). Graph showing significant changes in the number of pH3+ cells/section in the whole retina at different ages (Kruskal-Wallis test, p < 0.0001). (G). Graph showing significant changes in the number of pH3+ cells/section in the CMZ at different ages (Kruskal-Wallis test, p < 0.0001). (H). Graph showing significant changes in the number of pH3+ cells/section in the central retina at different ages (one-way ANOVA, p < 0.0001). (I). Graph showing significant changes in the number of PCNA+ cells/section in the central retina at different ages (Kruskal-Wallis test, p < 0.0001). Mean ± S.E.M. data and data on statistical multiple comparisons related to these graphs can be found on File S1. Asterisks indicate different levels of statistical significance: *, p < 0.05; **, p < 0.01; ***, p < 0.001; ****, p < 0.0001. |
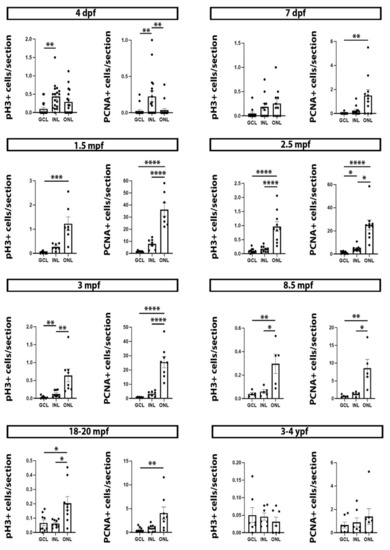
Graphs showing the differential distribution of pH3+ and PCNA+ cells in cell layers of the central retina at different developmental and life stages. 4 dpf specimens: pH3 (Kruskal-Wallis test, p = 0.0022), PCNA (Kruskal-Wallis test, p = 0.0018). 7 dpf specimens: pH3 (Kruskal-Wallis test, p = 0.0655), PCNA (Kruskal-Wallis test, p = 0.0024). 1.5 mpf specimens: pH3 (Kruskal-Wallis test, p < 0.0001), PCNA (one-way ANOVA, p < 0.0001). 2.5 mpf specimens: pH3 (one-way ANOVA, p < 0.0001), PCNA (Kruskal-Wallis test, p < 0.0001). 3 mpf specimens: pH3 (one-way ANOVA, p = 0.0009), PCNA (one-way ANOVA, p < 0.0001). 8.5 mpf specimens: pH3 (one-way ANOVA, p = 0.0055), PCNA (one-way ANOVA, p = 0.0038). 18–20 mpf specimens: pH3 (Kruskal-Wallis test, p = 0.0121), PCNA (Kruskal-Wallis test, p = 0.0084). 3–4 ypf specimens: pH3 (Kruskal-Wallis test, p = 0.4814), PCNA (Kruskal-Wallis test, p = 0.8584). Mean ± S.E.M. data and data on statistical multiple comparisons related to these graphs can be found on File S2. Asterisks indicate different levels of statistical significance: *, p < 0.05; **, p < 0.01; ***, p < 0.001; ****, p < 0.0001. |