
|
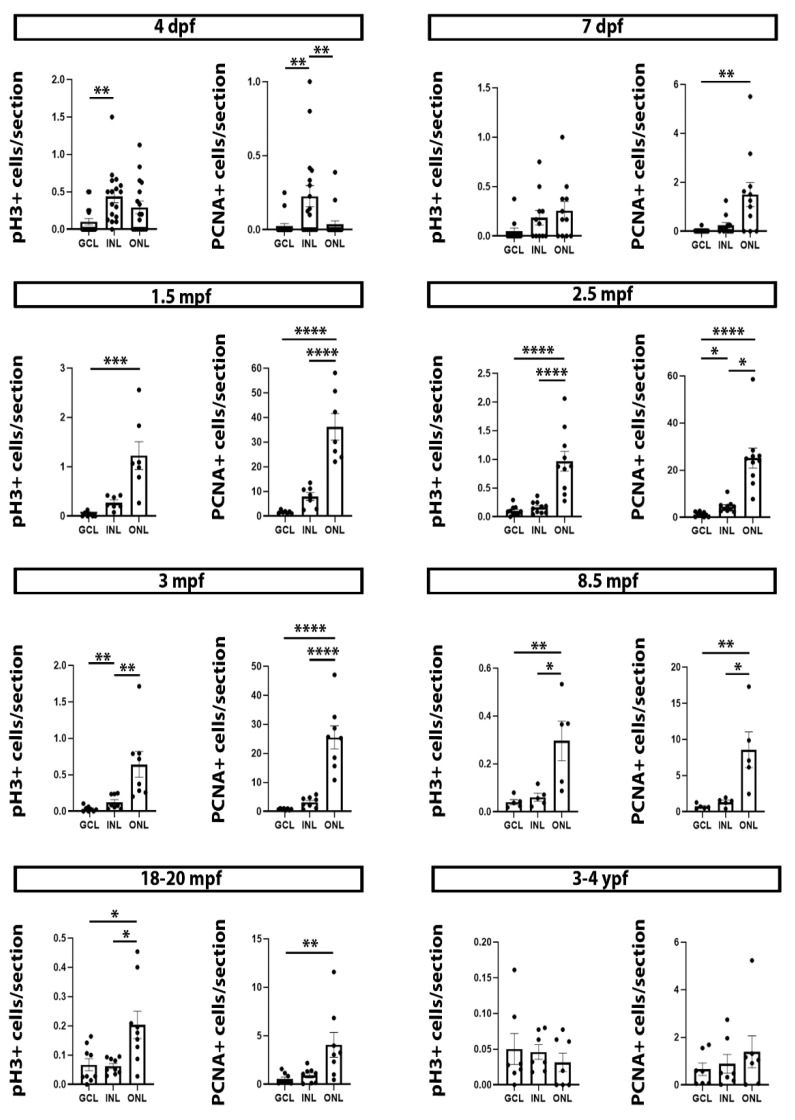
Figure 3
Graphs showing the differential distribution of pH3+ and PCNA+ cells in cell layers of the central retina at different developmental and life stages. 4 dpf specimens: pH3 (Kruskal-Wallis test, p = 0.0022), PCNA (Kruskal-Wallis test, p = 0.0018). 7 dpf specimens: pH3 (Kruskal-Wallis test, p = 0.0655), PCNA (Kruskal-Wallis test, p = 0.0024). 1.5 mpf specimens: pH3 (Kruskal-Wallis test, p < 0.0001), PCNA (one-way ANOVA, p < 0.0001). 2.5 mpf specimens: pH3 (one-way ANOVA, p < 0.0001), PCNA (Kruskal-Wallis test, p < 0.0001). 3 mpf specimens: pH3 (one-way ANOVA, p = 0.0009), PCNA (one-way ANOVA, p < 0.0001). 8.5 mpf specimens: pH3 (one-way ANOVA, p = 0.0055), PCNA (one-way ANOVA, p = 0.0038). 18–20 mpf specimens: pH3 (Kruskal-Wallis test, p = 0.0121), PCNA (Kruskal-Wallis test, p = 0.0084). 3–4 ypf specimens: pH3 (Kruskal-Wallis test, p = 0.4814), PCNA (Kruskal-Wallis test, p = 0.8584). Mean ± S.E.M. data and data on statistical multiple comparisons related to these graphs can be found on File S2. Asterisks indicate different levels of statistical significance: *, p < 0.05; **, p < 0.01; ***, p < 0.001; ****, p < 0.0001.