
Figure 2
- ID
- ZDB-FIG-211120-60
- Publication
- Hernández-Núñez et al., 2021 - Decline in Constitutive Proliferative Activity in the Zebrafish Retina with Ageing
- Other Figures
- All Figure Page
- Back to All Figure Page
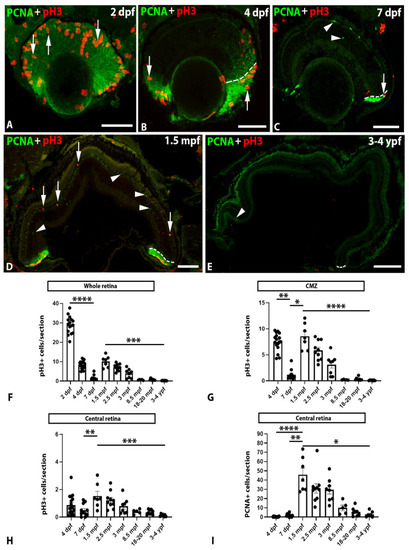
(A–E). Transverse sections of the retina of 2 dpf (A), 4 dpf (B), 7 dpf (C), 1.5 mpf (D), and 3–4 ypf (E) zebrafish specimens showing the presence of PCNA (arrowheads) or pH3 (arrows) positive cells. In 2 dpf to 1.5 mpf zebrafish (A–D), PCNA or pH3 expressing cells were mainly located in the CMZ but also in the central retina, while, in 3–4 ypf, specimens (E) pH3+ and PCNA+ cells almost disappeared. Dashed lines in (B–E) indicate the limit between the CMZ and the central retina. Scale bars: (A–C): 50 µm; (D): 100 µm; (E): 200 µm. (F). Graph showing significant changes in the number of pH3+ cells/section in the whole retina at different ages (Kruskal-Wallis test, p < 0.0001). (G). Graph showing significant changes in the number of pH3+ cells/section in the CMZ at different ages (Kruskal-Wallis test, p < 0.0001). (H). Graph showing significant changes in the number of pH3+ cells/section in the central retina at different ages (one-way ANOVA, p < 0.0001). (I). Graph showing significant changes in the number of PCNA+ cells/section in the central retina at different ages (Kruskal-Wallis test, p < 0.0001). Mean ± S.E.M. data and data on statistical multiple comparisons related to these graphs can be found on File S1. Asterisks indicate different levels of statistical significance: *, p < 0.05; **, p < 0.01; ***, p < 0.001; ****, p < 0.0001. |