
- Title
-
Metformin accelerates zebrafish heart regeneration by inducing autophagy
- Authors
- Xie, F., Xu, S., Lu, Y., Wong, K.F., Sun, L., Hasan, K.M.M., Ma, A.C.H., Tse, G., Manno, S.H.C., Tian, L., Yue, J., Cheng, S.H.
- Source
- Full text @ NPJ Regen Med

a Western blot analysis was performed to detect the expression of LC3-I and LC3-II in intact (sham control) and regenerating hearts from 1 to 14 days. The protein from three hearts was loaded into each lane, and GAPDH was used as the loading control. b, c Autophagic flux assay with a western blot of LC3 was conducted (b). The expression of LC3-II was quantified. The data are presented as mean ± SD, n = 3 repeats, **P < 0.01 vs cryoinjured hearts with CQ treatment (c). d, e The sham (control) or cryoinjured hearts of Tg(cmv:GFP-LC3) fish were isolated, embedded in paraffin, sectioned, and dual-immunostained with an anti-GFP antibody to detect LC3 (in green) and an anti-MF20 antibody to detect the cardiomyocytes (in red), after which they were co-stained with DAPI to label the nuclei (in blue). IA: injured area; V: ventricle. The arrowheads show the GFP-LC3 puncta in cardiomyocytes. Scale bars: 50 µm (d). The number of GFP-LC3 puncta in sham and in the injured area at 1 dpc, 4 dpc, 7 dpc, and 14 dpc was quantified. The data are presented as mean ± SD, n = 3 hearts, **P < 0.01 vs sham (e). f, g Electron micrographs of an intact (sham) heart, and a regenerating heart in the IA at 1 dpc and 7 dpc. In the injured area, there was an accumulation of autophagic vacuoles (see blue arrowheads). M: mitochondria. Scale bars: 2 µm (f). The number of autophagic vacuoles in sham and the injured area at 1 dpc and 7 dpc was quantified. The data are presented as mean ± SD, n = 3 hearts, **P < 0.01 vs sham (g). |
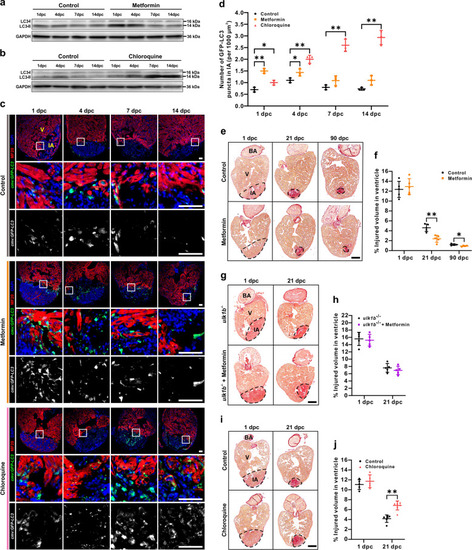
a, b Western blot analysis was performed in cryoinjured hearts treated with or without 50 µM metformin (a) or 100 µM CQ (b) to detect the expression of LC3-I and LC3-II from 1 to 14 dpc. The protein from three hearts was loaded into each lane, and GAPDH was used as the loading control. c, d After cryoinjury, the heart of Tg(cmv:GFP-LC3) fish treated with or without 50 µM metformin or 100 µM CQ, were isolated, fixed, sectioned and dual-immunostained with anti-GFP (green) and anti-MF20 (red), after which they were stained with DAPI (blue). IA: injured area; V: ventricle. Scale bars: 50 µm (c). The number of GFP-LC3 puncta in the injured area at 1 dpc, 4 dpc, 7 dpc, and 14 dpc was quantified. The data are presented as mean ± SD, n = 3 hearts, *P < 0.05, **P < 0.01 vs control (d). e–j Following cryoinjury, the AB fish were either untreated (control) or else they were treated with 50 µM metformin for up to 90 days (e, f), or they were treated with 100 µM CQ for up to 21 days (i, j); the ulk1b mutant fish generated by TALEN were also either untreated (control) or else they were treated with 50 µM metformin for up to 21 days (g, h). Paraffin sections were then prepared and stained with Picro Sirius red. BA: bulbous arteriosus. Scale bars: 200 µm. The injured volume percentage was then quantified in the ventricle of the control and metformin (f, h) or CQ (j) treatment groups at the different time points. The data are presented as mean ± SD, n = 4 to 7 hearts, *P < 0.05, **P < 0.01 vs control. |

a, b After cryoinjury, the Tg(cmlc2:EGFP) fish were maintained in untreated fish water (control) or in fish water containing 50 µM metformin or 100 µM CQ for the indicated days. The hearts were then isolated, fixed, sectioned and dual-immunostained with an anti-GFP antibody to identify the cardiomyocytes (in green) and an anti-PCNA antibody to identify proliferating cells (in red), after which they were co-stained with DAPI to label the nuclei (in blue). V: ventricle; IA: injured area. The white arrows show the proliferating cardiomyocytes. Scale bars: 50 µm (a). The proliferating cardiomyocytes in the untreated control, metformin and CQ treated fish at 1 dpc, 4 dpc, 7 dpc, and 14 dpc were quantified. The data are presented as mean ± SD, n = 5 hearts, **P < 0.01 vs control (b). c, d After heart cryoinjury, AB fish were maintained in untreated fish water (control) or in fish water containing 50 µM metformin or 100 µM CQ. The hearts were prepared, and immunostained with an anti-embCMHC (N2.261) antibody for the identification of embryonic cardiac myosin heavy chain (in red) and then they were labeled with DAPI. The arrowheads show the signal of embCMHC. Scale bar: 100 µm (c). The percentage of embCMHC positive cells in the control, metformin and CQ treated fish at 1 dpc, 4 dpc, 7 dpc, and 14 dpc was quantified. The data are presented as mean ± SD, n = 5 hearts, *P < 0.05, **P < 0.01 vs control (d). |

a After heart cryoinjury, the Tg(fli1a:EGFP) fish, which express EGFP specifically in the endocardium and vascular endothelium, were maintained in untreated fish water (control) or in fish water containing 50 µM metformin or 100 µM CQ for 1–14 days. The hearts were then isolated, fixed, sectioned and immunostained with an anti-GFP antibody (in green), and co-labeled with DAPI to show the nuclei (in blue). V: ventricle; IA: injured area. Scale bar: 100 µm. b The percentage of Fli1a expressing cells in the injured area of the control, metformin and CQ treated fish at 1 dpc, 4 dpc, 7 dpc, and 14 dpc was quantified. The data are presented as mean ± SD, n = 3 hearts, **P < 0.01 vs control. |

a After cryoinjury, the Tg(tcf21:DsRed2) line of fish, which express DsRed2 (in pink) specifically in the epicardium were maintained in untreated fish water (control) or in fish water containing 50 µM metformin or 100 µM CQ for 1–21 days. The hearts were then isolated and directly embedded in capillaries with 1% low melting agarose gel, after which a Z-stack of frontal view images through the ventricular apex were acquired ex vivo using light sheet fluorescence microscopy. The Z-stack images were displayed in three dimensions with surface render mode. The dashed line in each image indicates the injured area. Scale bar: 200 µm. b The injured epicardial area of the control, metformin, and CQ-treated fish at 1 dpc, 4 dpc, 7 dpc, 14 dpc, and 21 dpc were quantified. The data are presented as mean ± SD, n = 3 hearts, *P < 0.05 vs control. |

a The hearts of AB fish were cryoinjured, and then the fish were maintained in untreated fish water (control) or in fish water containing 50 µM metformin or 100 µM CQ for 1–14 days. Sections were then prepared and stained with the MSB trichrome stain to show fibrin (in dark red) and collagen (in blue). V: ventricle; IA: injured area. Scale bar: 100 µm. b, c The hearts of Tg(cmv:GFP-LC3) fish were cryoinjured, and then the fish were maintained in untreated fish water (control) or in fish water containing 50 µM metformin or 100 µM CQ for 1-14 days. The hearts were then isolated, fixed, sectioned, and dual-immunostained with an anti-GFP antibody to label LC3 (in green) and an anti-vimentin antibody to label fibroblasts (in red), after which they were labeled with DAPI to show the nuclei (in blue). Scale bars: 50 µm (b). The numbers of GFP-LC3 puncta in the fibroblasts in the injured area of the control, metformin and CQ treated fish were quantified. The data are presented as mean ± SD, n = 3 hearts, *P < 0.05, **P < 0.01 vs control (c). |