
|
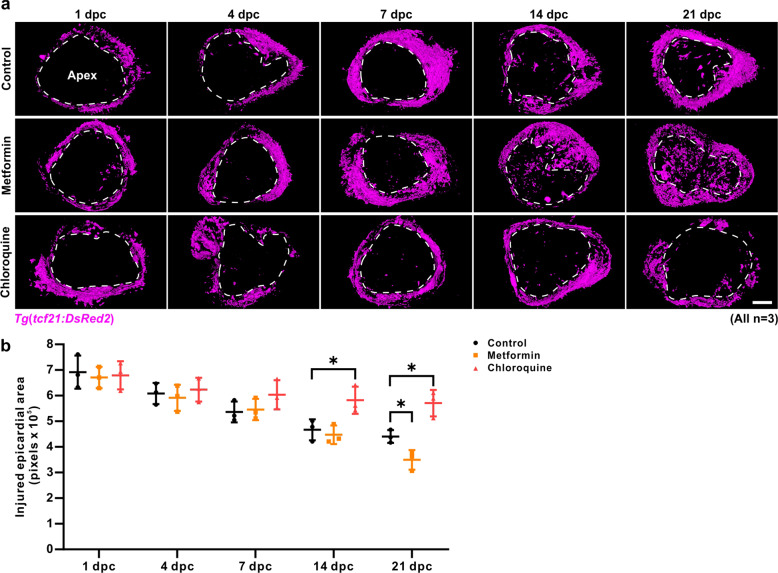
Fig. 5
a After cryoinjury, the Tg(tcf21:DsRed2) line of fish, which express DsRed2 (in pink) specifically in the epicardium were maintained in untreated fish water (control) or in fish water containing 50 µM metformin or 100 µM CQ for 1–21 days. The hearts were then isolated and directly embedded in capillaries with 1% low melting agarose gel, after which a Z-stack of frontal view images through the ventricular apex were acquired ex vivo using light sheet fluorescence microscopy. The Z-stack images were displayed in three dimensions with surface render mode. The dashed line in each image indicates the injured area. Scale bar: 200 µm. b The injured epicardial area of the control, metformin, and CQ-treated fish at 1 dpc, 4 dpc, 7 dpc, 14 dpc, and 21 dpc were quantified. The data are presented as mean ± SD, n = 3 hearts, *P < 0.05 vs control.