FIGURE SUMMARY
Title

The localization of amyloid precursor protein to ependymal cilia in vertebrates and its role in ciliogenesis and brain development in zebrafish

Authors
Chebli, J., Rahmati, M., Lashley, T., Edeman, B., Oldfors, A., Zetterberg, H., Abramsson, A.
Source
Full text @ Sci. Rep.

Expression pattern of appa and appb mRNA. (A,B) Schematic representations of head and ventricle morphology of a 30 hpf zebrafish larvae, lateral (A) and dorsal (B) view. (C,H) Whole-mount fluorescent in situ of appa (C) and appb (H) in 30 hpf WT zebrafish larvae. Single focal planes, dorsal to ventral, of whole-mount larvae of appa (DG) and appb (IL) probe. (M) Schematic view of focal plane of the dorsal area of the brain ventricle. (NQ) Single focal plane at high magnification (40×) of appa (N,O) and appb (P,Q) probes. T telencephalic ventricle, D/M diencephalic/mesencephalic ventricle, R rhombencephalic ventricle, Ob olfactory bulb, Oe olfactory epithelium, P pituitary gland, Le lens, Ot optic tectum, Tg trigeminal ganglia, Rh rhombomeres, Ov otic vesicle. Magnification: (CL) = 20×, (NQ) = 40×. Scale bar: (C) = 100 µm, (D) = 50 µm, (N) = 25 µm. *Indicates ventricular space and white arrows highlight appa and appb expression at the ventricular borders.

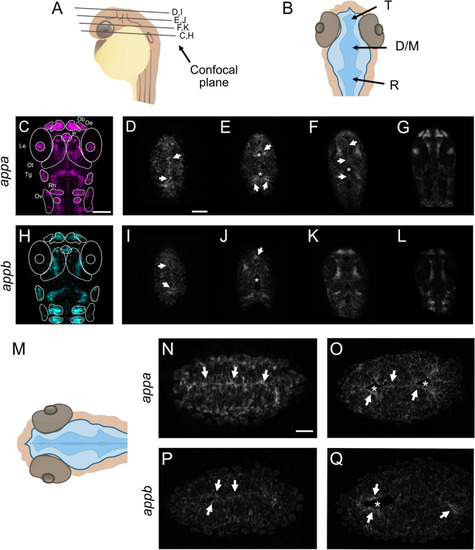
Localization of App protein to cilia of the olfactory sensory neurons and otic vesicle in 31 hpf larvae. Cilia as shown by immunostaining for acetylated tubulin (magenta) and App (green) of the olfactory sensory neurons in the nose epithelium (A) and the otic vesicle (BC). In (A), dotted lines demarcate the cilia from the nasal cavity (see asterisk). (A’) App (green) is found along the cilia and accumulating at their base. Otic vesicle of 24 hpf (B) and 31 hpf larvae (C). In (B), glutamylated tubulin (cyan) highlights the base of the cilia outlined by acetylated tubulin staining (magenta). (B) Overview of the kinocilia and stereocilia of the otic vesicle. The white asterisks indicate accumulation of App (green) at the base of the cilia bundles. (B’) Magnification of cilia outlined in (B). (B’’) Increased intensity of the green channel to detect App (arrows) in kinocilia. Otic vesicle in 31hpf zebrafish larvae (C) with close-up (C’) showing App puncta (green) along the kinocilia. Intensity profiles of acetylated tubulin (magenta) and App (green) staining from the kinocilia (DF). In (D), the intensity profile of the whole length of the kinocilium is plotted whereas profiles of cross-section lines are plotted with a visible App puncta (E) and without (F). The dotted lines (C’) indicate the kinocilium and cross-sections. Magnification: (AC) = 40×. Scale bar: (A) = 5 µm, (B) = 10 µm, (B’) = 4 µm, (B’’) = 2 µm, (C) = 10 µm.

App localizes to the cilia decorating the ventricle of larvae and ependymal cells in adult zebrafish. (A) Schematic representations of head and ventricle morphology in 30 hpf zebrafish larvae, dorsal view. (B) Dorsal view of ventricle immunostained for App (green) and acetylated tubulin (magenta) in 30 hpf WT zebrafish larvae. (C) Close-up of cilia (magenta) and App (green). (D) Negative controls for immunofluorescence with secondary antibodies without anti-acetylated tubulin and anti-App primary antibodies. Cell nuclei stained with DAPI (blue). (E) Schematic outline of adult zebrafish brain, lateral view. (F–G) Coronal section of adult zebrafish brain and the central canal (see asterisk). Cell nuclei labeled with DAPI (blue), acetylated tubulin (magenta), App (green). (G) Ependymal motile cilia (magenta) of the central canal with App (green) accumulation along cilia. Magnification: (B,F) = 10×, (D) = 40×, (C,G) = 60×. Scale bar: (B,D) = 50 µm, (C) = 1 µm, (F) = 500 µm, (G) = 10 µm.

EXPRESSION / LABELING:
Antibodies:
Fish:
Anatomical Terms:
Stage Range: Prim-15 to Adult

APP is localized to the ependymal cilia in adult mouse. (A) Schematic representation of adult mouse brain ventricular system, sagittal view. (B) Overview of sagittal section from adult mouse brain and the third ventricle (see dotted square in (A)) for cell nuclei stained with DAPI (blue), acetylated tubulin (magenta), APP (green). (CD) Close-up of ependymal cells and their cilia tufts (magenta) and APP expression with anti-APP Y188 antibody (C) and 22C11 antibody (D). (E) Negative controls of immunofluorescence staining without primary antibodies and only with the corresponding secondary antibodies. For cell nuclei with DAPI (blue). LV lateral ventricle, III third ventricle, IV fourth ventricle, H hippocampus, Cp choroid plexus, Ep ependyma. Magnification: (B) = 10×, (E) = 40×, (C,D) = 60×. Scale bar: (B) = 200 µm, (C,D) = 10 µm, (E) = 50 µm.

APP is localized to human ependymal cilia. (
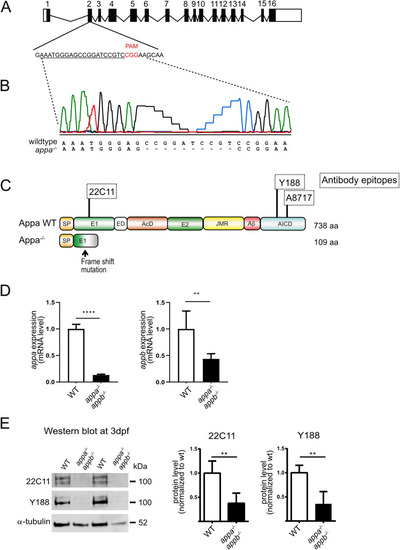
A) Brightfield overview of a human brain section of the caudate nucleus immunostained with an anti-acetylated tubulin antibody reveals the different cellular layers (I–IV): (I) ependymal layer with motile cilia orienting towards the ventricle lumen, (II) cellular extensions connecting the ependymal cells, (III) cellular layer dense in astrocytes, (IV) brain parenchyma. (BE) Higher magnifications of the ependymal layer show clear cilia (acetylated tubulin (B,D)) and APP (Y188 antibody (C,E)) accumulation within ependymal cells and along ependymal cilia. (E’). Arrows highlight ependymal cilia tufts in the ventricular lumen. White asterisks indicate broken or absent cilia. Dotted lines delimitate the ependymal cell layer. Magnification: (A) = 20×, (B,C) = 40×, (D,E) = 100×. Scale bar: (A) = 5 µm, (B) = 10 µm, (D) = 2 µm.

Generation of appa−/− and analysis of appa−/−appb−/− double mutant zebrafish. (A) Schematic outline of the appa gene with exons (black box) and UTR regions (white box). sgRNA used to target exon 2 with protospacer adjacent motif (PAM) in red and the sgRNA target sequence underlined. (B) Sanger sequencing chromatogram of the exon 2 region targeted in wild-type zebrafish. The appa−/− mutant sequence is given below with dash indicating deleted nucleotides. (C) Schematic drawing of the wild-type Appa protein (738 aa) with epitopes of antibodies (dotted squares) used above and the hypothetical truncated Appa (109 aa) protein produced in appa mutant below. (D) qPCR quantification of appa and appb mRNA levels in wild-type and appa−/−appb−/− mutants at 24 hpf. (E) Western blot of 3 dpf whole larvae zebrafish with antibodies against 22C11 and App (Y188). Alpha-tubulin is used as loading control. Blots cropped from the same original gel and grouped. Quantification of band intensity are shown relative to control. Data are reported as mean ± SD. ** ρ < 0.05, **** ρ < 0.001. qPCR n = 5, WB n = 3. SP signal peptide, E1 extracellular domain, ED extension domain, AcD acidic domain, E2 extracellular domain 2, JMR juxtamembrane region, amyloid beta, AICD amyloid intracellular domain.

Longer cilia of dorsal brain ventricle neuroepithelium in appa−/−appb−/− larvae zebrafish. At 30hpf, appa−/−appb−/− exhibit longer diencephalic/mesencephalic ventricle cilia than WT. Data are reported as mean ± SEM. **** ρ < 0.001. n = 10 WT (1091 cilia), 16 appa−/−appb−/− (1511 cilia).

Structural integrity of ependymal cilia in WT and appa−/−appb−/− zebrafish. Transmission electron microscopy of adult zebrafish ependymal cilia of WT (AD) and appa−/−appb−/− mutant (EH) adult zebrafish. (A,E) Overview of ependymal cilia of the central canal. (B,F) Longitudinal view on the axoneme of the cilia composing its core, the transition zone including the ciliary pit between the cilia core and the cellular membrane and the basal body containing the cilia centrioles, highlighted with increased signal. In (C,G), cross-sections of cilia. (DH) Zoom on cross-section of individual cilia showing (9 + 2) microtubule doublet organization. Scale bar: (A,E) = 1 µm, (B,C,F,G) = 200 nm, (D,H) = 50 nm.

The appa−/−appb−/− 2 dpf larvae zebrafish exhibit smaller brain ventricle. Dorsal 3D surface rending of confocal stacks

taken from brain ventricles of dextran injected 2 dpf zebrafish larvae (A). Quantification of total ventricle surface area and volume show that both are decreased in appa-/-appb-/- larvae (B). Lateral 3D surface rending of confocal stacks from brain ventricles of dextran injected 2 dpf zebrafish larvae with close up on diencephalic ventricle (C). Quantification of surface area and volume of the diencephalic ventricle in WT and appa-/-appb-/- larvae (D). Measurement of gross ventricle morphology at 2dpf WT and appa-/-appb-/- larvae as the length (E). Distance between rostral to caudal, diencephalon ventricle sagittal length, amplitude and height show no significant difference in mutants (F). Data are reported as mean ± SEM. ** ρ < 0.01, **** ρ < 0.001. n: (B) WT = 19, appa-/-appb-/- = 34, (D) WT = 8, appa-/-appb-/- = 34, (F) WT = 5, appa-/-appb-/- = 4.

Unillustrated author statements

Acknowledgments
This image is the copyrighted work of the attributed author or publisher, and ZFIN has permission only to display this image to its users. Additional permissions should be obtained from the applicable author or publisher of the image. Full text @ Sci. Rep.