- Title
-
Generation of a Triadin KnockOut Syndrome Zebrafish Model
- Authors
- Vecchi, V.M., Spreafico, M., Brix, A., Santoni, A., Sala, S., Pistocchi, A., Marozzi, A., Di Resta, C.
- Source
- Full text @ Int. J. Mol. Sci.

ZFIN is incorporating published figure images and captions as part of an ongoing project. Figures from some publications have not yet been curated, or are not available for display because of copyright restrictions. |
|
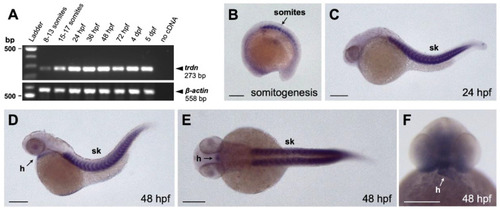
Expression analysis of trdn in zebrafish embryo. (A) RT-PCR performed on RNA isolated from zebrafish embryos at different developmental stages. β-actin was used as the loading control. (B–F) WISH analyses with a trdn-specific probe in zebrafish embryos. trdn is expressed in skeletal muscles and heart. (B–D) Lateral view of a 13 somite (B, anterior to the left), 24 hpf (C) and 48 hpf (D) embryos. (E,F) Dorsal (E) and frontal (F) view of a 48 hpf embryo. Scale bars indicate 100 μm. sk, skeletal muscle; h, heart. EXPRESSION / LABELING:
|
|
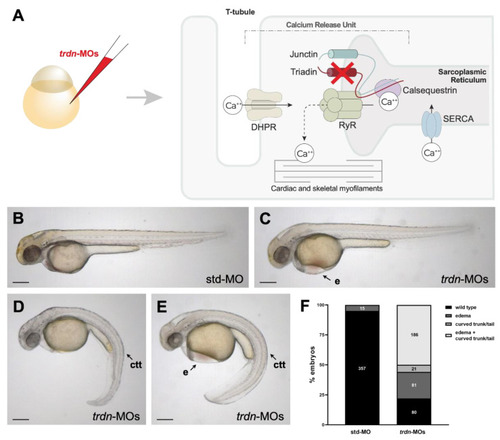
Phenotypical analysis of embryos with trdn loss-of-function. (A) Schematic representation of Triadin interactions network and trdn knockdown strategy. RyR: ryanodine receptor; DHPR: dihydropyridine receptor; SERCA: sarco-endoplasmic reticulum calcium ATPase (B–E) Representative bright field images of the phenotype of 48 hpf embryos injected with std-MO and trdn-MOs. (F) Classification of the phenotypes obtained with trdn-MOs injection. Values indicate the number of embryos for each phenotype. Scale bars indicate 100 μm. e, edema; ctt, curved trunk/tail. PHENOTYPE:
|
|
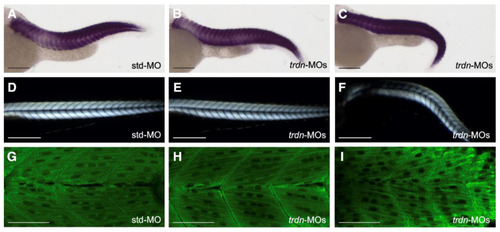
Skeletal muscle morphology evaluation. (A–C) Representative images of WISH analysis using a ckma probe in std-MO (A), class 1 wild-type-like (B) and class 3 affected (C) trdn-MO-injected embryos at 48 hpf. (D–F) Representative birefringence images of std-MO (D), class 1 wild-type-like (E) and class 3 affected (F) trdn-MO-injected embryos at 3 dpf. (G–I) Representative MF20 immunofluorescence images of std-MO (G), class 1 wild-type-like (H) and class 3 affected (I) trdn-MO-injected embryos. (A–F) Scale bars indicate 100 µm. (G–I) Scale bars indicate 50 μm. |
|
Heart morphology and function evaluation. (A,B) Frontal view of 48 hpf std-MO and trdn-MOs embryos hybridized with cmlc2 probe using WISH technique. Scale bars indicate 100 μm. (C,D) Semithin section of std-MO and trdn-MOs embryos in the heart region. Scale bars indicate 100 μm. (E) Quantification of heartrate in embryos at 48 hpf injected with std-MO and trdn-MOs. (F) Percentage of embryos with a heartbeat superior to the mean of the heartbeat (bpm) of trdn-MOs. (G) Heartbeat count in 3 dpf std-MO and trdn-MOs untreated or adrenaline-, isoprenaline- and atropine-treated embryos. (H) Heartbeat count in 3 dpf std-MO and trdn-MOs untreated or treated with metoprolol or flecainide. (F–H) At least 30 embryos were analyzed for each group. Values are expressed as mean ± SEM. *** p < 0.001, ** p < 0.01, n.s. = not significant, Mann–Whitney test (E) and one-way ANOVA followed by Tukey post-hoc correction (G,H). Adr, adrenaline; Iso, isoprenaline; Atr, atropine. EXPRESSION / LABELING:
PHENOTYPE:
|


