
IMAGE
Figure 3
- ID
- ZDB-IMAGE-211002-122
- Genes
- Antibodies
- Publication
- Vecchi et al., 2021 - Generation of a Triadin KnockOut Syndrome Zebrafish Model
- All Figures
- Figures for Vecchi et al., 2021
Image
|
Figure Caption
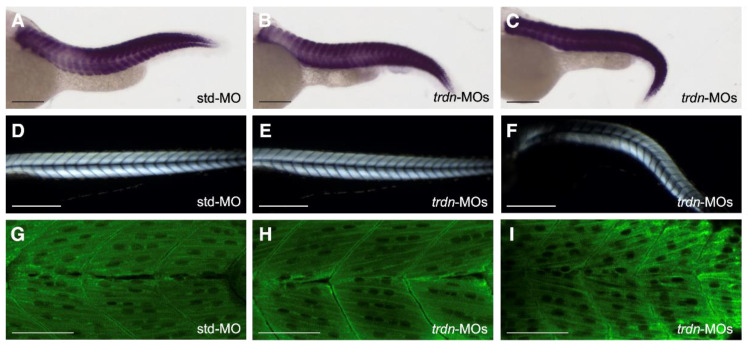
Figure 3
Skeletal muscle morphology evaluation. (A–C) Representative images of WISH analysis using a ckma probe in std-MO (A), class 1 wild-type-like (B) and class 3 affected (C) trdn-MO-injected embryos at 48 hpf. (D–F) Representative birefringence images of std-MO (D), class 1 wild-type-like (E) and class 3 affected (F) trdn-MO-injected embryos at 3 dpf. (G–I) Representative MF20 immunofluorescence images of std-MO (G), class 1 wild-type-like (H) and class 3 affected (I) trdn-MO-injected embryos. (A–F) Scale bars indicate 100 µm. (G–I) Scale bars indicate 50 μm.
Figure Data
Acknowledgments
This image is the copyrighted work of the attributed author or publisher, and
ZFIN has permission only to display this image to its users.
Additional permissions should be obtained from the applicable author or publisher of the image.
Full text @ Int. J. Mol. Sci.