
FIGURE
Figure 1
- ID
- ZDB-FIG-211002-116
- Publication
- Vecchi et al., 2021 - Generation of a Triadin KnockOut Syndrome Zebrafish Model
- Other Figures
- All Figure Page
- Back to All Figure Page
Figure 1
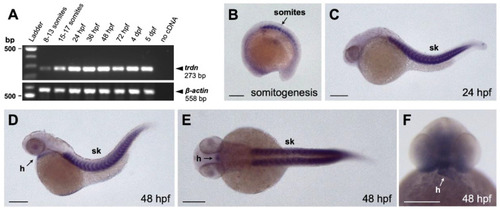
Expression analysis of trdn in zebrafish embryo. (A) RT-PCR performed on RNA isolated from zebrafish embryos at different developmental stages. β-actin was used as the loading control. (B–F) WISH analyses with a trdn-specific probe in zebrafish embryos. trdn is expressed in skeletal muscles and heart. (B–D) Lateral view of a 13 somite (B, anterior to the left), 24 hpf (C) and 48 hpf (D) embryos. (E,F) Dorsal (E) and frontal (F) view of a 48 hpf embryo. Scale bars indicate 100 μm. sk, skeletal muscle; h, heart. |
Expression Data
| Gene: | |
|---|---|
| Fish: | |
| Anatomical Terms: | |
| Stage Range: | 5-9 somites to Day 5 |
Expression Detail
Antibody Labeling
Phenotype Data
Phenotype Detail
Acknowledgments
This image is the copyrighted work of the attributed author or publisher, and
ZFIN has permission only to display this image to its users.
Additional permissions should be obtained from the applicable author or publisher of the image.
Full text @ Int. J. Mol. Sci.