- Title
-
Definitive hematopoietic stem cells minimally contribute to embryonic hematopoiesis
- Authors
- Ulloa, B.A., Habbsa, S.S., Potts, K.S., Lewis, A., McKinstry, M., Payne, S.G., Flores, J.C., Nizhnik, A., Feliz Norberto, M., Mosimann, C., Bowman, T.V.
- Source
- Full text @ Cell Rep.
|
Developmental hematopoietic heterogeneity identified in zebrafish with single-cell RNA sequencing (scRNA-seq)
(A) Schema of scRNA-seq experiment: (1) drl:mCherry+;gata1:GFP− cells were isolated by fluorescence-activated cell sorting (FACS) from pools of 1 and 2 dpf embryos to enrich for HSPCs, (2) 10X Genomics single-cell RNA libraries were prepared and sequenced, and (3) downstream computational analysis showing that UMAP dimensional reduction and unsupervised clustering of drl:mCherry+;gata1:GFP− cells at 1 and 2 dpf with Monocle3 gives 10 clusters. (B) Cell-type identification of the 10 Monocle3 clusters performed using key hematopoietic marker genes supported by previous zebrafish, murine, and human literature. Cell types identified include erythroid progenitors (EryPs), clusters 1–3 (c1–c3); lympho-erythroid-primed progenitor (LEP), cluster 4 (c4); pre-hemogenic endothelial cells (pre-HE), cluster 5 (c5); hemogenic endothelial cells generating HSCs (HE/HSC), cluster 6 (c6); lymphoid progenitor (LyP), cluster 7 and 10 (c7,10); lymphomyeloid progenitor with higher macrophage marker expression (LMP-M), cluster 8 (c8); and lymphomyeloid progenitor with higher granulocyte marker expression (LMP-G), cluster 9 (c9). Expression bar: scaling is performed per gene where mean is close to 0 and standard deviation of 1. Only genes with the highest scaled expression value will show the brightest yellow color in any of the cells (standard deviation above −2), and those that have the lowest scaled expression will be purple (standard deviation below 2). (C) The cell-type classifications in UMAP space as identified in (B). (D) RNA velocities overlaid over UMAP clusters of drl:mCherry+gata1:GFP− cells at 1 and 2 dpf. The different colors represent the Seurat clusters derived from reprocessing the data. The dotted lines encircling each cluster are cell types identified with previously used marker genes (refer to Figure S1D). Arrows indicate inferred differentiation trajectory as determined by RNA velocities. (E and F) Enrichment pathway analysis of upregulated top marker genes in pre-HE (E) and HE/HSC (F) clusters, conducted using Metascape. Top 200 markers selected using Monocle3 with the following criteria: fraction expressing >10% and marker test p < 0.00005. The colored circles after each term in the significance bar plot (left) represent a colored dot on the network representation (right). See also Figure S1. |
|
Dynamic regulation of the drl promoter distinguishes HSPC subsets
(A) UMAP dimensional reduction and unsupervised clustering of drl:mCherry+;gata1:GFP− cells at 1 and 2 dpf showing their original collection time point. (B) mCherry expression level driven by the drl promoter for the different cell types collected at 1 and 2 dpf. (C) (i) Schematic illustrating drl-specific, 4-OHT-inducible lineage-tracing system. Tg(drl:creERT2) homozygous transgenic fish were crossed with hemizygous ubi:loxP-GFP-stop-loxP-mCherry (ubi:Switch). (ii) Zebrafish embryos were exposed to 12 μM 4-OH-tamoxifen (4-OHT) or ethanol (EtOH) vehicle control for 20 h starting at either 30 hpf (labeled as Prog+, which includes embryonic progenitors and HSCs) or 54 hpf (labeled as HSC). Those embryos exposed to 4-OHT induce Cre recombination of loxP sites, leading to a permanent “switch” excising the GFP cassette and resulting in expression of mCherry fluorescence. The resulting mCherry+ cells are the descendants of Prog+− and HSC-labeled cells. (iii) Representative flow cytometry analysis: forward (FSC) and side scatter (SSC) parameters were used to define the major blood cell populations (erythroid, myeloid, lymphoid, and precursor) in whole kidney marrow (WKM) (>3 months). (iv) The frequency of mCherry+ cells within each cell lineage was then calculated. Example flow cytometry plots (right) of mCherry contribution to the myeloid population. Gates were set based on EtOH-treated “non-switched” controls. (D) Quantification of mCherry+ percentage from experimental groups Prog+ and HSCs within each blood cell lineage found in WKM at >3 months post-fertilization (zebrafish adulthood). Data points represent individual zebrafish WKM with mean ± SEM (n = 5–12). (E) Quantification of mCherry+ percentage at 1–5 days post-labeling in Prog+ and HSC-labeled cohorts. n = 5–11 samples, 7–10 pooled larvae per sample. Two-way ANOVA with Sidak’s multiple comparison test was used for analysis (mean ± SEM). *p < 0.05; ****p ≤ 0.0001. See also Figure S2. |
|
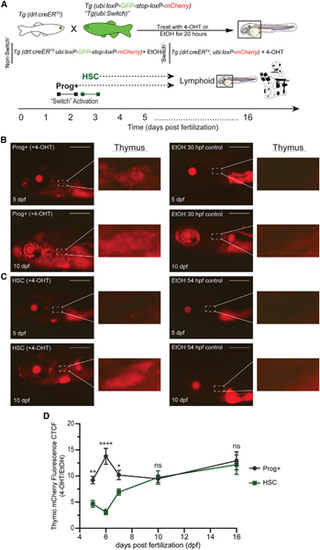
Thymic T cell contribution by embryonic progenitors and HSCs is distinct
(A) Experimental schema of 4-OHT-inducible lineage tracing to examine larval T cell production in the thymus from Prog+− and HSC-labeled cohorts. (B and C) Fluorescent images of 4-OHT-induced switch (left) and EtOH non-switched controls (right) Tg(drl:creERT2;ubi:Switch) larvae for Prog+ (B) and HSC (C) populations. Top images are 5 dpf larvae, and bottom images are 10 dpf larvae. Dashed box and inset showing the thymus where T cells colonize. mCherry+ fluorescence corresponds to drl+ switched daughter cells. Scale bars, 500 μm. Representative images are shown, with quantification in (D). (D) Quantification of mCherry fluorescence intensity in the thymic region in larvae of Prog+− and HSC-labeled cohorts measured over a time course of 5–16 dpf. Mean ± SEM of the mCherry+ corrected total cell fluorescence (CTCF) at each time point is shown. Two-way ANOVA with Sidak’s multiple comparison (n = 6–30 per larvae/day). *p ≤ 0.05; **p ≤ 0.01; ****p ≤ 0.0001. See also Figure S3. |
|
Granulocyte contribution by embryonic progenitors and HSCs is distinct
(A) Experimental schema of 4-OHT-inducible lineage tracing to examine larval granulocyte production from Prog+− and HSC-labeled cohorts. Granulocytes are distinguished by high GFP expression from the mpx:GFP transgene compared to the low GFP intensity of ubi:Switch. (B) Fluorescent images of the tail region of 4 dpf Tg(mpx:GFP) (left), Tg(ubi:Switch) (middle), and Tg(mpx:GFP;ubi:Switch) (right). mpx:GFP+ granulocytes are denoted by yellow arrowheads. Scale bars, 500 μm. (C) Overlay flow cytometry plot (left) showing higher levels of mpx:GFP signal in Tg(drl:reERT2;mpx:GFP;ubi:Switch) (dark purple) compared to Tg(drl:creERT2;ubi:Switch) control (light blue). The frequency of mCherry+ switch cells was then calculated in the GFPhigh fraction in Prog+− and HSC-labeled cohorts. Representative flow cytometry plots from 5 dpf larvae (right). (D) Quantification of percentage of mCherry+ cells within the mpx:GFPhigh fraction in Prog+ and HSC populations measured over a time course of 2–16 dpf (n = 3–7 samples, 7–10 fish per sample). Mean ± SEM of the mCherry+ percentage at each time point is shown. Two-way ANOVA with Sidak’s multiple comparison was used for this analysis. **p ≤ 0.01; ***p ≤ 0.001. See also Figure S4. |
|
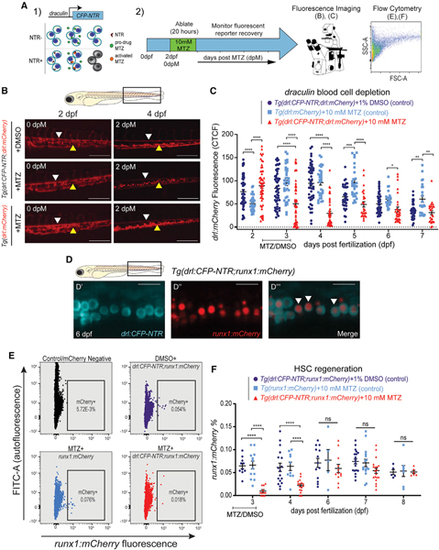
HSCs regenerate following their targeted depletion in early development
(A) Experimental schema of regeneration assay: (1) mechanism: drl promoter drives expression of a CFP-NTR (nitroreductase) transgene. NTR converts metronidazole (MTZ) into a toxic intermediate that triggers apoptosis of only drl:CFP-NTR-expressing cells; (2) timeline: Tg(drl:CFP-NTR) or control larvae were treated with 10 mM MTZ or 1% DMSO vehicle control for 20 h from 54–74 h post-fertilization (~2–3 dpf) to specifically target HSCs and were then monitored for their recovery using fluorescence imaging and flow cytometry. (B) Fluorescent images of Tg(drl:CFP-NTR+;drl:mCherry+) and Tg(drl:mCherry+) embryos treated with 10 mM MTZ or 1% DMSO (control) at 2 and 4 dpf (0 and 2 days post-MTZ [dpM], respectively). Arrowheads indicate remaining stationary (yellow) and circulatory (white) cells within the caudal hematopoietic tissue (CHT; boxed region in schematic of zebrafish larva, above). Scale bars, 500 μm. (C) Quantification of drl:mCherry CTCF levels in treated groups and control groups: (Tg(drl:CFP-NTR;drl:mCherry) + 1% DMSO (purple), Tg(drl:mCherry) + 10 mM MTZ (light blue); and Tg(drl:CFP-NTR;drl:mCherry) + 10 mM MTZ (red) (n = 17–54 larvae). (D) Confocal fluorescent images showing cytoplasmic drl:CFP-NTR expression (D′), nuclear runx1:mCherry expression (marking HSPCs) (D′′), and merged (D′′′) within the CHT of a 6 dpf zebrafish, with white arrowheads indicating double-positive cells. Scale bars, 500 μm. (E) Flow cytometry plots of runx1:mCherry and fluorescein isothiocyanate (FITC) (autofluorescence control) in untreated negative controls (black), Tg(drl:CFP-NTR;runx1:mCherry) + 1% DMSO, Tg(runx1:mCherry) + 10 mM MTZ; and Tg(drl:CFP-NTR;runx1:mCherry) + 10 mM MTZ. (F) Quantification of runx1:mCherry+ % from (E) flow cytometry experiments in treated and control groups. n = 5–19, 7–10 pooled larvae per sample. Two-way ANOVA with Tukey’s multiple comparisons test was used for all statistical analyses. Plots are individual points for each biological replicate with mean ± SEM. ****p ≤ 0.0001. See also Figure S5. |
|
Depletion of HSCs has a negligible impact on T cell seeding of larval thymus
(A) Fluorescent images of drl:CFP-NTR (A′), rag2:mCherry (marking T-lymphocytes) (A′′) and merged (A′′′) at 5 dpf in the thymic lymphoid tissue. Scale bars, 500 μm. Merged fluorescent image (A′′′′) shows higher magnification image of (A′′′). (B) Experimental schema of the NTR/MTZ system. (C) Fluorescent images of Tg(drl:CFP-NTR+; rag2:mCherry+) and Tg(rag2:mCherry+) larvae shown at 4 and 6 dpf (2 and 4 dpM, respectively) after depletion of HSCs using the NTR/MTZ system. Yellow arrowheads indicate rag2:mCherry+ fluorescent lymphocytes within the thymus. Scale bars, 500 μm. (D) Quantification of rag2:mCherry fluorescence CTCF levels in Tg(drl:CFP-NTR+;rag2:mCherry+) and Tg(rag2:mCherry+) zebrafish treated with 10 mM MTZ or 1% DMSO (n = 19–72 larvae). (E) Flow cytometry plots of rag2:mCherry and FITC (autofluorescence control) in untreated negative controls (black); Tg(drl:CFP-NTR;rag2:mCherry) + 1% DMSO (purple); Tg(rag2:mCherry) + 10 mM MTZ (light blue); and Tg(drl:CFP-NTR;rag2:mCherry) + 10 mM MTZ (red). (F) Quantification of rag2:mCherry% from (E) flow cytometry experiments in treated and control groups; n = 4–11, 7–10 pooled larvae per sample. Two-way ANOVA with Tukey’s multiple comparisons test was used for all statistical analyses. Plots are individual data points for each biological replicate with mean ± SEM. ns, not significant; *p < 0.05; **p ≤ 0.01; ***p ≤ 0.001. |
|
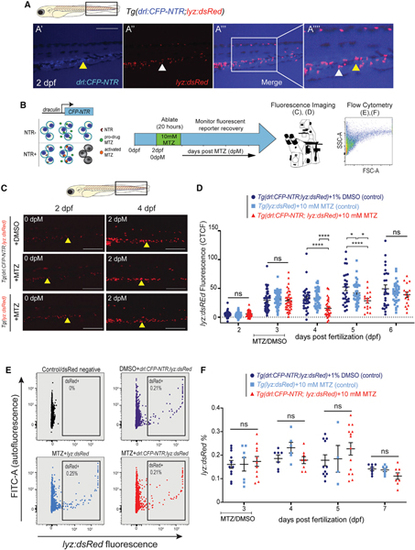
Depletion of HSCs has a negligible impact on granulocyte frequency
(A) Fluorescent images of drl:CFP-NTR (A′), lyz:dsRed (marking myeloid cells) (A′′), and merged (A′′′) at 2 dpf showing minimal co-expression. Scale bars, 500 μm. White arrow marks lyz:dsRed single-positive granulocyte, and yellow arrowhead marks drl:CFP-NTR single-positive cell; 1.75× inset in (A′′′′). (B) Experimental schema of the NTR/MTZ system. (C) Fluorescent images of Tg(drl:CFP-NTR+;lyz:dsRed+) and Tg(lyz:dsRed+) embryos treated with either 1% DMSO or 10 mM MTZ, shown at 2 and 4 dpf (0 and 2 dpM, respectively). Yellow arrowhead showing stationary cells in the CHT region. Scale bars, 500 μm. (D) Quantification of lyz:dsRed fluorescence CTCF levels in Tg(drl:CFP-NTR+;lyz:dsRed+) and Tg(lyz:dsRed+) embryos treated with 10 mM MTZ or 1% DMSO (n = 16–45). (E) Flow cytometry plots of lyz:dsRed and FITC (autofluorescence control) in untreated negative controls (black); Tg(drl:CFP-NTR;lyz:dsRed) + 1% DMSO (purple); Tg(lyz:dsRed) + 10 mM MTZ (light blue); and Tg(drl:CFP-NTR;lyz:dsRed) + 10 mM MTZ (red). (F) Quantification of lyz:dsRed% from flow cytometry experiments (E) in treated and control groups (n = 4–14 samples, 7–10 pooled larvae per sample). Two-way ANOVA with Tukey’s multiple comparisons test was used for all statistical analyses. Plots are individual data points for each biological replicate with mean ± SEM. ns, not significant; *p < 0.05; ****p ≤ 0.0001. |


