
|
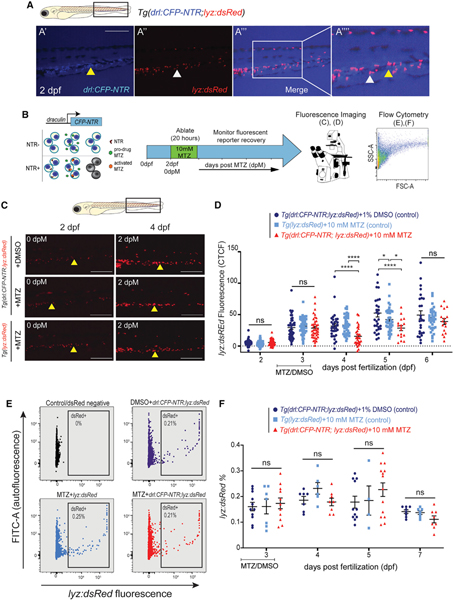
Fig. 7
(A) Fluorescent images of drl:CFP-NTR (A′), lyz:dsRed (marking myeloid cells) (A′′), and merged (A′′′) at 2 dpf showing minimal co-expression. Scale bars, 500 μm. White arrow marks lyz:dsRed single-positive granulocyte, and yellow arrowhead marks drl:CFP-NTR single-positive cell; 1.75× inset in (A′′′′).
(B) Experimental schema of the NTR/MTZ system.
(C) Fluorescent images of Tg(drl:CFP-NTR+;lyz:dsRed+) and Tg(lyz:dsRed+) embryos treated with either 1% DMSO or 10 mM MTZ, shown at 2 and 4 dpf (0 and 2 dpM, respectively). Yellow arrowhead showing stationary cells in the CHT region. Scale bars, 500 μm.
(D) Quantification of lyz:dsRed fluorescence CTCF levels in Tg(drl:CFP-NTR+;lyz:dsRed+) and Tg(lyz:dsRed+) embryos treated with 10 mM MTZ or 1% DMSO (n = 16–45).
(E) Flow cytometry plots of lyz:dsRed and FITC (autofluorescence control) in untreated negative controls (black); Tg(drl:CFP-NTR;lyz:dsRed) + 1% DMSO (purple); Tg(lyz:dsRed) + 10 mM MTZ (light blue); and Tg(drl:CFP-NTR;lyz:dsRed) + 10 mM MTZ (red).
(F) Quantification of lyz:dsRed% from flow cytometry experiments (E) in treated and control groups (n = 4–14 samples, 7–10 pooled larvae per sample).
Two-way ANOVA with Tukey’s multiple comparisons test was used for all statistical analyses. Plots are individual data points for each biological replicate with mean ± SEM. ns, not significant; *p < 0.05; ****p ≤ 0.0001.