
|
Fig. 4
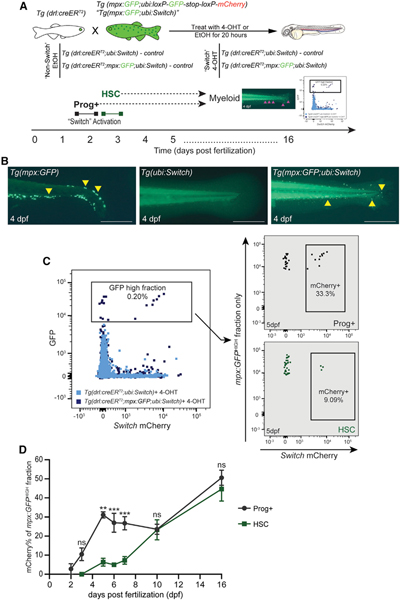
(A) Experimental schema of 4-OHT-inducible lineage tracing to examine larval granulocyte production from Prog+− and HSC-labeled cohorts. Granulocytes are distinguished by high GFP expression from the mpx:GFP transgene compared to the low GFP intensity of ubi:Switch.
(B) Fluorescent images of the tail region of 4 dpf Tg(mpx:GFP) (left), Tg(ubi:Switch) (middle), and Tg(mpx:GFP;ubi:Switch) (right). mpx:GFP+ granulocytes are denoted by yellow arrowheads. Scale bars, 500 μm.
(C) Overlay flow cytometry plot (left) showing higher levels of mpx:GFP signal in Tg(drl:reERT2;mpx:GFP;ubi:Switch) (dark purple) compared to Tg(drl:creERT2;ubi:Switch) control (light blue). The frequency of mCherry+ switch cells was then calculated in the GFPhigh fraction in Prog+− and HSC-labeled cohorts. Representative flow cytometry plots from 5 dpf larvae (right).
(D) Quantification of percentage of mCherry+ cells within the mpx:GFPhigh fraction in Prog+ and HSC populations measured over a time course of 2–16 dpf (n = 3–7 samples, 7–10 fish per sample). Mean ± SEM of the mCherry+ percentage at each time point is shown. Two-way ANOVA with Sidak’s multiple comparison was used for this analysis. **p ≤ 0.01; ***p ≤ 0.001. See also Figure S4.