
- Title
-
An ancient adenosine receptor gains olfactory function in bony vertebrates
- Authors
- Kowatschew, D., Korsching, S.I.
- Source
- Full text @ Genome Biol. Evol.
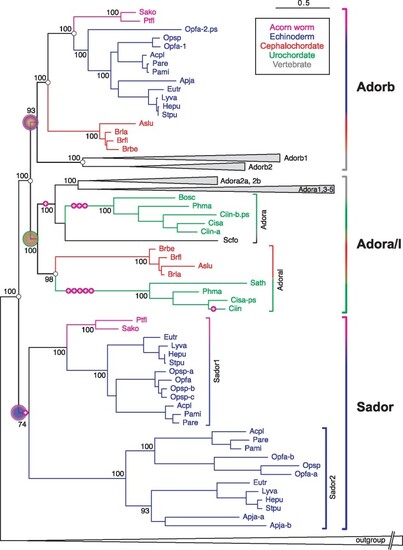
The evolutionary origin of the nucleotide receptor adorb in the MRCA of deuterostomes. Maximum likelihood tree for adora, adorb, and related receptors. Branch support is given in %, scale bar denotes number of amino acid substitutions per site. Species groups are color-coded as indicated, all vertebrate clades are collapsed. Magenta circles with plus sign indicate intron gains, small empty circles denote absence of introns. Gene clades are visualized by angular parentheses, color-coded according to the species represented in that clade. Species are indicated by four letter abbreviation, for full names see supplementary file 3, Supplementary Material online. The root of the adora, adorb, and sador clade is denoted by large circles, color-coded according to species represented within that clade. Adora, adoral, adorb, and sador clades are well separated with high to maximum branch support. Adorb is present in all deuterostome groups analyzed except urochordates. The outgroup (collapsed) consists of over 100 genes encompassing all subgroups of rhodopsin class GPCRs as well as rhodopsin-associated class genes (see supplementary file 3, Supplementary Material online). |
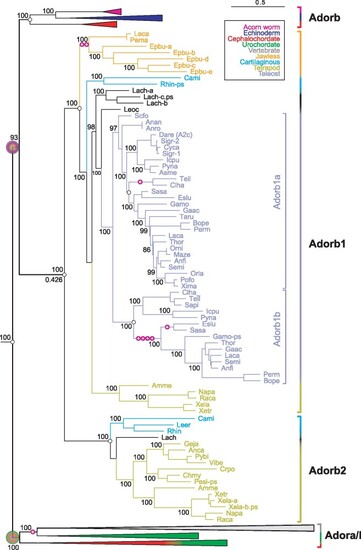
Evolution of the adorb gene clade in vertebrates. Maximum likelihood tree for adora, adorb, and related receptors, same tree file as figure 1, only vertebrate adorb clade expanded here. Branch support is given in %, for the root of the adorb clade also the common branch length is given (0.426); scale bar denotes number of amino acid substitutions per site. Species groups are color-coded as indicated, all nonvertebrate nodes and the vertebrate adora node are collapsed. Magenta circles with plus sign indicate intron gains; small empty circles denote absence of introns. Gene clades are visualized by angular parantheses, color-coded according to the species represented in that clade. Species are indicated by four letter abbreviation, for full names see supplementary file 3, Supplementary Material online. The outgroup (not shown) consists of over 100 genes encompassing all subgroups of rhodopsin class GPCRs as well as rhodopsin-associated class genes (see supplementary file 3, Supplementary Material online). The root of the adora and adorb clade is denoted by large circles, color-coded according to species represented within that clade. The vertebrate adorb clade is well separated with maximum branch support. Coelacanth (Lach) and hagfish (Epbu) show small gene expansions, the remaining increases in gene number result from two whole genome duplications or polyploidy (Sigr, Xela). |
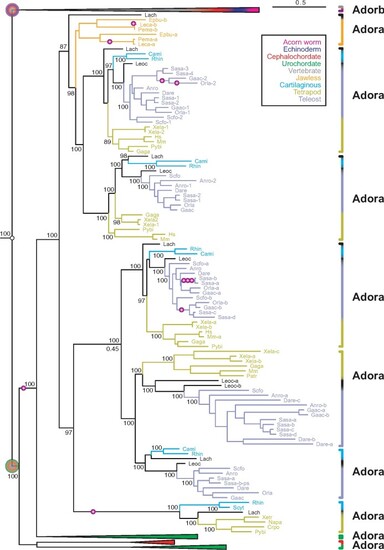
Two novel adora genes in vertebrates. Maximum likelihood tree for adora, adorb and related receptors, same tree file as figure 1, only vertebrate adora clade expanded here. Branch support is given in %, scale bar denotes number of amino acid substitutions per site. Species groups are color-coded as indicated; all nonvertebrate nodes and the vertebrate adorb node are collapsed. Magenta circles with plus sign indicate intron gains; small empty circles denote absence of introns. Gene clades are visualized by angular parantheses, color-coded according to the species represented in that clade. Species are indicated by four letter abbreviation, for full names see supplementary file 3, Supplementary Material online. The outgroup (not shown) consists of over 100 genes encompassing all subgroups of rhodopsin class GPCRs as well as rhodopsin-associated class genes (see supplementary file 3, Supplementary Material online). The root of the adora and adorb clade is denoted by large circles, color-coded according to species represented within that clade. The vertebrate adora clade is well separated with maximum branch support. Orthologs for mammalian genes adora1, 2a, 2b, and 3 are present in teleosts, for the first three also in cartilaginous fish. Two novel clades, adora4 and 5, are present in cartilaginous fish, lobe-finned fish, and ray-finned fish, respectively amphibians. Remnants of the teleost-specific whole genome duplication are visible, some other increases in gene number result from polyploidy, for example, salmon. |
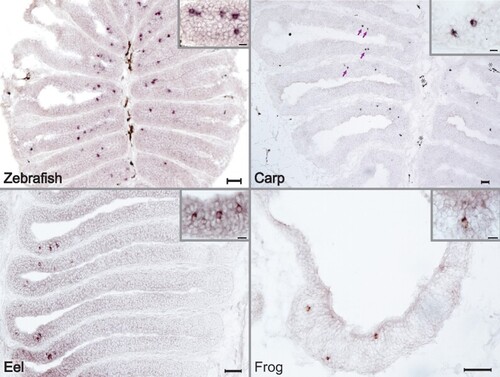
Across a wide evolutionary range adorb is expressed in sparsely distributed cells within the olfactory epithelium. Species-specific adorb1 probes were used to perform chromogenic ISH of horizontal cryostat sections of olfactory epithelia for three fish (zebrafish, top left panel; carp, top right panel; eel, bottom left panel) and one amphibian species (clawed frog, bottom right panel). Insets at higher magnification; scale bars in main panels 50 µm, in insets 10 µm. EXPRESSION / LABELING:
|
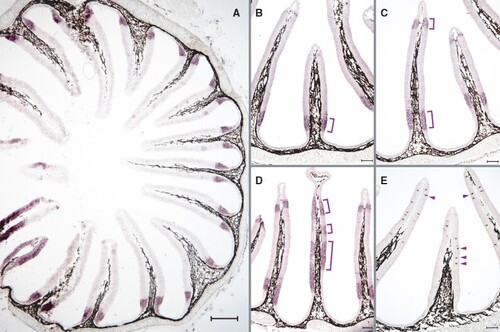
Expression of lamprey adorb in contiguous segments of the nose is distinctly different from that observed in jawed vertebrates. ISH was performed in horizontal cross-sections of the olfactory organ of L. fluviatilis using NBT/BCIP for visualizing adorb1 (A–D) and tarl7a (aka Lor3) expression (E). Adorb1 is expressed in a contiguous region adjacent to the olfactory sensory area (A, B), in some cases close to the inner tip (C) and rarely in intermediate zones (D) of the OE. In contrast, a known olfactory receptor (Lor3, Berghard and Dryer 1998), is sparsely distributed in the olfactory sensory area (E). Scale bar (A) 300 µm, (B–E) 100 µm. |
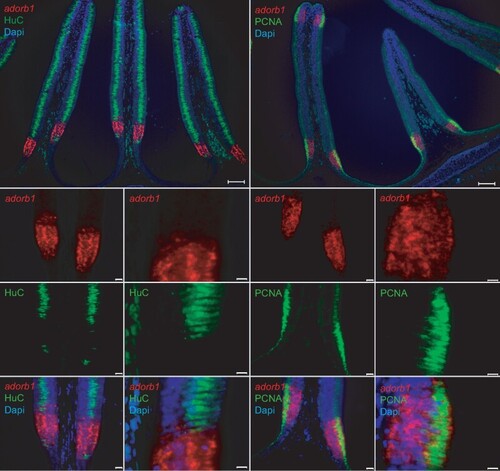
Lamprey adorb1 expression zone borders the sensory area of the olfactory organ. Double labeling of horizontal cross-sections of L. fluviatilis olfactory epithelium with HuC antibody and PCNA antibody confirms the expression of adorb1 (visualized by ISH) in a nonsensory region. Genes and color as indicated on the respective panels, nuclei are visualized by DAPI staining (blue). The neuronal marker HuC (left columns, green) labels the olfactory sensory area of the lamella, whereas PCNA (right columns, green) labels the adjacent mitotic regions. Adorb1 (red) is expressed in a contiguous manner in the PCNA-positive region, but absent from the sensory region. Note that PCNA labeling (green) is restricted to the apical layer, whereas adorb1(red) staining is distributed more broadly. Top panels show an overview (scale bars 100 µm); the smaller bottom panels are enlarged (scale bars 50 and 10 µm, respectively). |
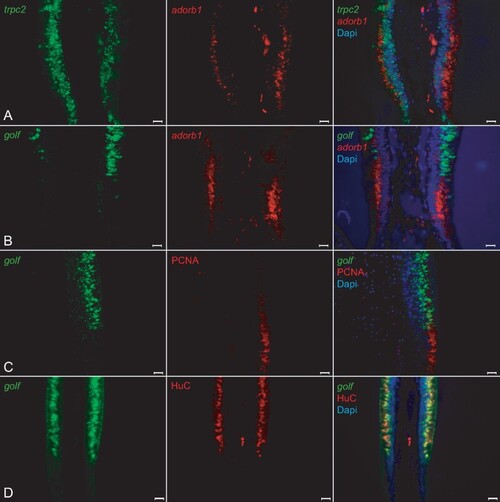
Adorb1-expressing cells in lamprey are negative for several neuronal markers. Horizontal cross-sections of L. fluviatilis olfactory epithelium were double labeled with OSN markers in several combinations; nuclei are visualized with DAPI. Left and middle columns, single label; right column, merged pictures. Orientation of panels: the adorb1-positive region is always below the adjacent sensory region. All scale bars are 20 µm. (A, B) Double ISH with neuronal markers for microvillous and ciliated OSNs (trpc2, and golf, respectively) and adorb1 shows no coexpression with either marker. (A) Unexpectedly, trpc2 (green) is expressed both in the sensory region and the adorb1-positive (red) segment. However, no double-labeled cells are seen. The nature of the trpc2-positive cells in the nonsensory region is unclear. (B) golf (green) is expressed in the sensory area, and exclusive of adorb1 expression (red). (C, D) Double labeling of golf with HuC and PCNA antibodies shows extensive overlap of golf and HuC at the cellular level, and complete absence of overlap for golf and PCNA, as expected. |
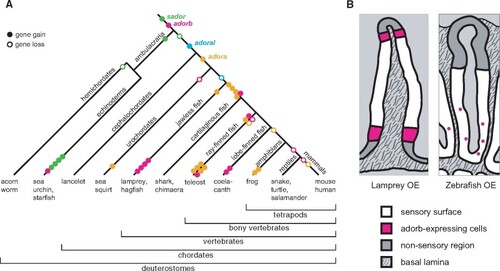
Evolutionary dynamics of adorb and related clades and transition in adorb expression patterns between jawless and jawed fish. (A) Dynamic evolution in the adora, adorb and related clades inferred from the phylogenetic analysis. The evolutionary history is depicted using maximum parsimony. Genes are color-coded as indicated and gene name is given at the birth of the respective clade. Each gene duplication event is shown as filled circle, an empty circle denotes a gene loss in the respective species group. Late gene duplication events are shown close to the tips, species-specific gene losses are not shown to keep the figure legible. Gene duplications resulting from a whole genome duplication are counted as one event. (B) Schematic representation of adorb expression in lamprey and zebrafish. Cross sections of a lamella are shown for lamprey (left panel) and zebrafish (right panel). Magenta, cells expressing adorb; white, sensory surface; light gray, lumen; medium gray, nonsensory region; stippled gray, basal lamina. |